HTML and CSS Reference
In-Depth Information
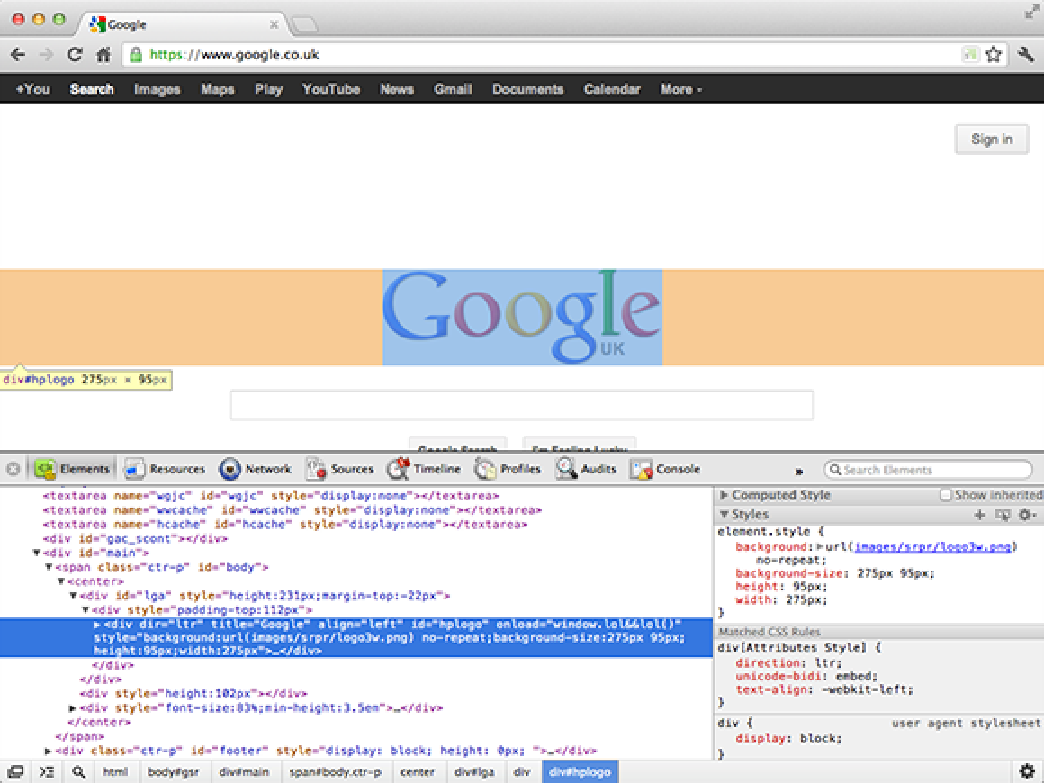
Figure 1-2
Inspecting a web page using the Chrome developer tools.
You can change the location of the Firebug tools panel by clicking the Firebug icon in the top-left corner
and selecting an option from the Firebug UI Location menu.
•
Dragonfly for Opera
—Opera's Dragonfly developer tools are built directly into the browser so there are no
extensions to install. You can access Dragonfly by going to Tools
⇒
Advanced and selecting Opera Dragon-
fly.
Dragonfly has many of the standard developer tools that you would expect from a modern browser. The
Documents and Scripts tabs will be particularly useful when building the examples in this topic. Note that
the developer tools are updated automatically when new versions are released.
•
Web Inspector in Safari
—Safari's Web Inspector Developer Tools are similar to the developer tools found
in Google Chrome. That's because they are both built upon the Web Inspector tools in WebKit.
Before you can access the developer tools in Safari, you need to enable them. To do this, open the Preferen-
ces pane by pressing Ctrl plus the comma key in Windows or Command plus the comma key on a Mac. In
the Preferences pane, click on the Advanced tab and select the checkbox labeled Show Develop Menu in
Menu Bar. You should now see the Develop menu appear in the menu bar at the top of the screen. If you use
Safari on Windows, you may need to display the menu bar by clicking the cog in the top-right corner and