Database Reference
In-Depth Information
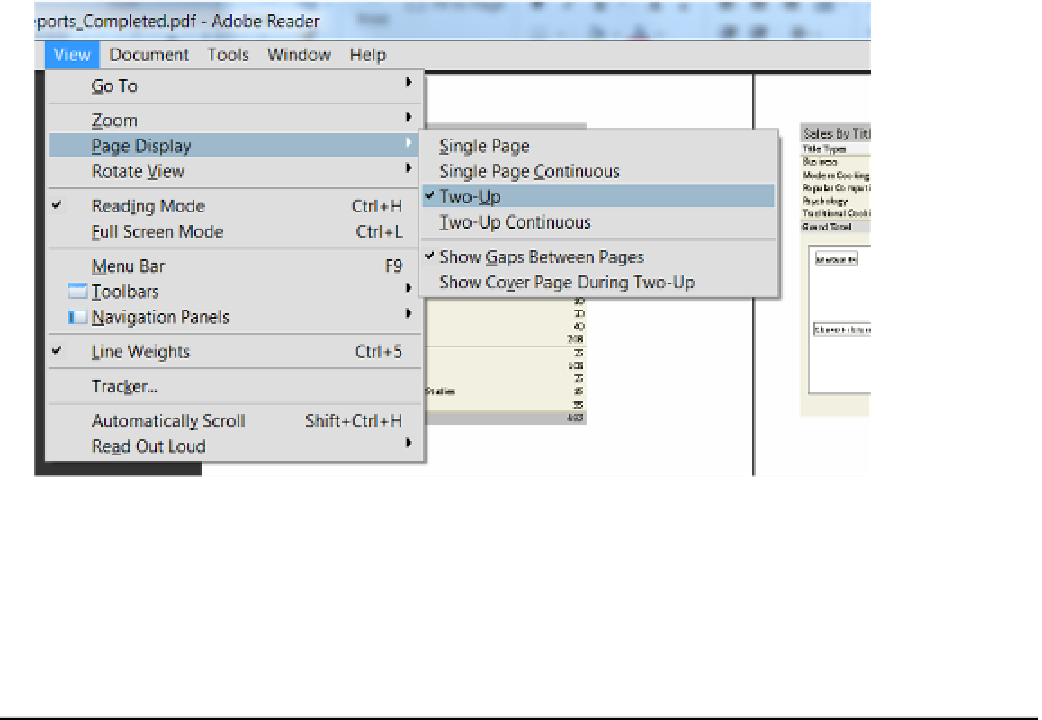
Adjusting the look may be easier said than done. To get the report looking just the way you want it, expect to
adjust your Excel report and resave it repeatedly. You can use the View
➤
Page Display
➤
Two-Up menu item
in Adobe Reader to show the reports side-by-side (figure
15-37
).
Figure 15-37.
Viewing the reports side-by-side in Adobe Reader
You can find both our original Excel spreadsheet and the PDf version in the downloadable book files
(
C:\_BookFiles\Chapter15Files\ExcelReports
).
now that you have saved two PivotTable and PivotChart reports to PDf, you are able to distribute them as you
would any other file, such as by email, a network share, or a sharePoint web site.
Moving On
Excel is a powerful tool for creating reports, but in the end its focus is on user-created, self-service reporting.
When you need more advanced, server-based reporting, the tool of choice is SQL Server Reporting Server (SSRS),
which leads us to our next chapter.
learn bY doing
in this “learn by Doing” exercise, you create Excel reports for your northwind cube, similar to the ones
defined in this chapter. we have included an outline of the steps you performed in this chapter and an
example of how the authors handled them in two word documents. These documents are found in the folder
C:\_BookFiles\_LearnByDoing\Chapter15Files
. Please see the
ReadMe.doc
file for detailed instructions.