Database Reference
In-Depth Information
Keep in mind that these tools are not made for the end user. Instead, the end user will use something like
an Excel spreadsheet or a Reporting Server report to view the data. This function is simply a convenience for the
developer who has just finished creating a cube and wants to review and validate the cube's design. Expect to
configure, process, and browse the cube repeatedly as you go through the development cycle.
Before you complete your validations, you should view the cube using a common reporting application
like Microsoft Excel. In SQL 2012, Microsoft has conveniently included a way to open an Excel spreadsheet from
the cube's Browser tab. The button is next to the language dropdown box and has the icon that is used for older
versions of Excel. You can see it circled in Figure
11-14
. Clicking this button launches Excel and presents you with
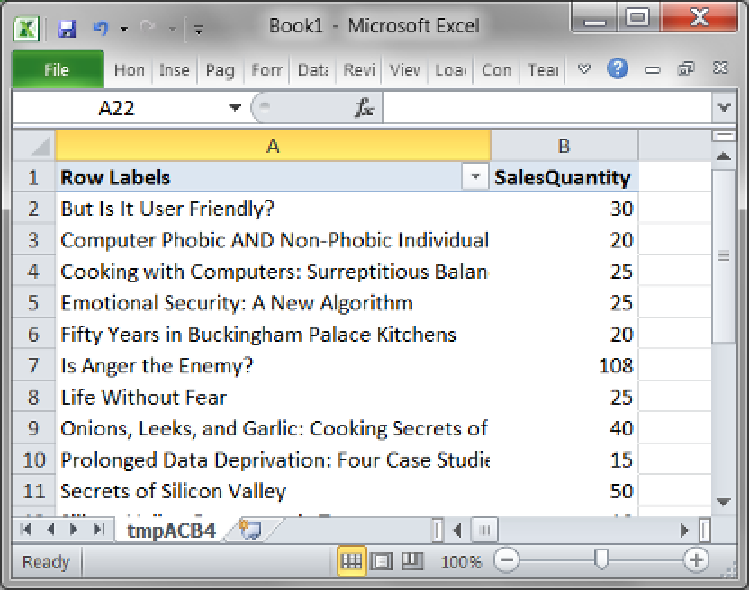
a pivot table report, as shown in Figure
11-15
. We discuss Excel pivot tables in Chapter 15, but for now let's look
at some of the other tabs in the cube designer.
Figure 11-15.
An Excel pivot table generated with the cube Browser tab
Validate the Measures
When checking your work in the browser, we recommend starting with the measures. One reason for this is that
attempting to use the dimensions in the browser without a measure may not give you any useful results.
Drag and drop a measure to the view pane. You will see the grand total for that measure. In Figure
11-16
,
you can see that we have dragged all of the measures into the viewing pane and now are seeing the grand total
for each one.