Database Reference
In-Depth Information
The second radio button, “Create an empty cube,” allows you to create an empty cube that you can add to
later. This option bypasses the remainder of the wizard.
The third radio button, “Generate tables in the data source,” allows you to create virtual tables in the data
source view. These tables can be scripted into SQL code that can then be run on your data warehouse to create
the real relational tables. This is an interesting option because it allows you to start with a blank data warehouse
and creates your cube first, designing your measures and your dimensions on top of the blank data warehouse.
After you have finished configuring your cube and dimensions in the SSAS project, you can have Visual Studio
generate an entire SQL script that will create your data warehouse tables.
The third option, “Generate tables in the data source,” includes a dropdown box that allows you to use
predefined templates for your cube and dimensions. These templates are just the XML files that came from
another Visual Studio SSAS project. You can make one of these templates yourself by making an SSIS project,
configuring it as you like, and then copying all the files and folders for the project to a predefined folder that comes
with your SQL installation. Your path may vary, but the standard installation places the folder at this location:
C:\Program Files (x86)\Microsoft SQL Server\110\Tools\Templates\olap\1033\Cube Templates
.
The basic concept behind this template option is that a consultant can make a predefined cube and
dimension structure that the client's company recommends. The consultant would then bring it to the client's
site, modify the cube and dimensions to the client's needs, and then reverse engineer the data warehouse to fit
the cubes and dimensions in the SSAS project. Afterward, the developer needs to set up an ETL process to fill the
new data warehouse, but this is just one more way to implement a BI project.
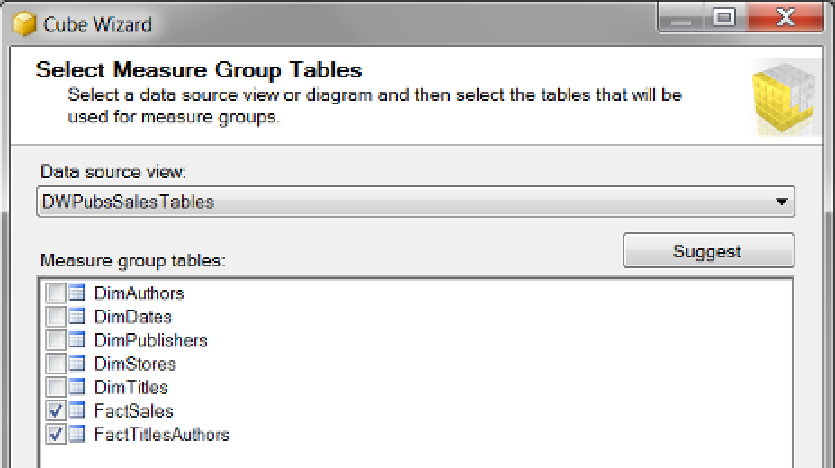
After you select the creation method, click Next to advance the wizard to the Select Measure Group Tables
dialog window. This window allows you to choose which fact tables will be included in the cube (Figure
11-3
).
Figure 11-3.
Selecting the measure group tables
In our example, we have two fact tables: one that contains the measures and one that is used as a bridge
between the Authors many-to-many dimension. As you can see in Figure
11-3
, we select both tables, because
both are necessary if we want to use all of the dimensions we created.
Clicking Next moves you to the Select Measures dialog window shown in Figure
11-4
. You need to decide
which measures are appropriate to use. In our example, we leave them all checked.