Database Reference
In-Depth Information
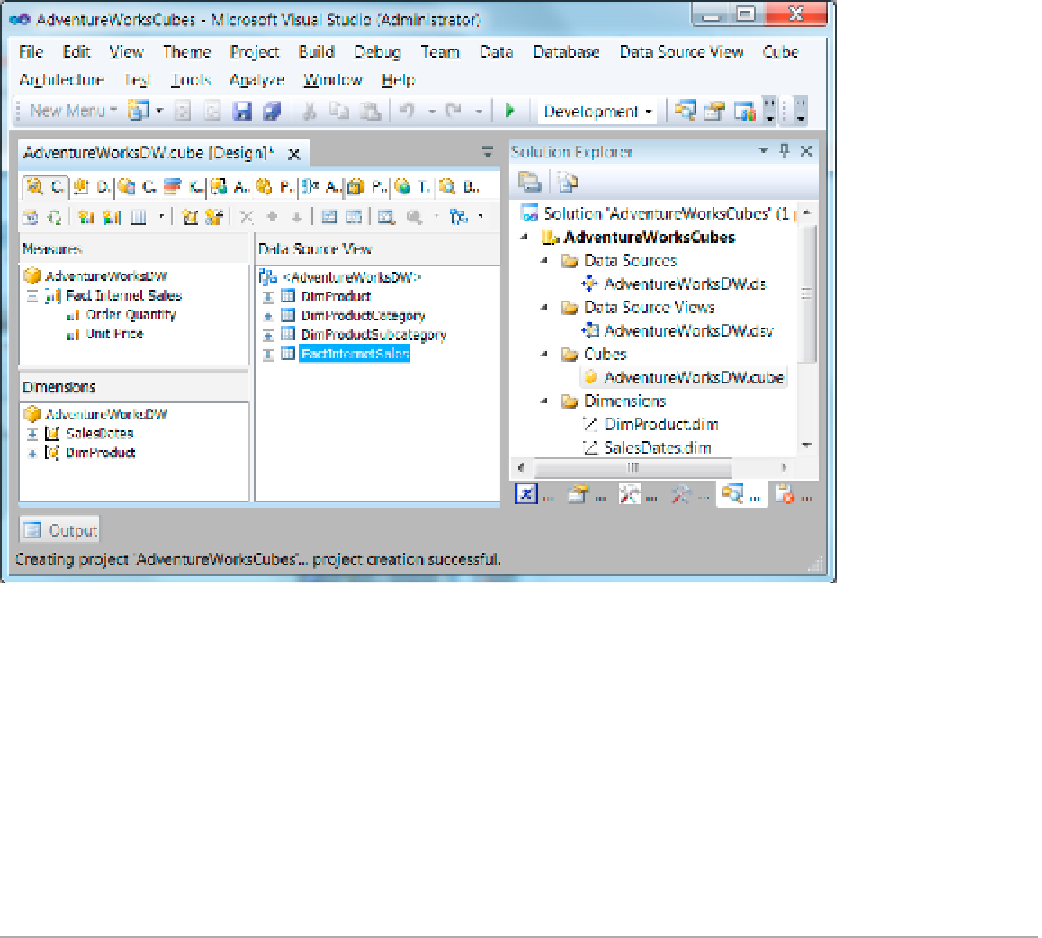
Figure 1-4.
Configuring a cube in SSAS
Step 6: Create Reports
Once you have your data loaded into a data warehouse and/or cube, you need to create preliminary reports
to continue your work. These may be your first reports for your BI solution, but they certainly will not be the
last. The end goal of a BI solution is to convert data into usable information, and that information is routinely
represented within reports.
he term
BI solution
is not very self-explanatory. It might be better if the industry as a whole changed the
term
business intelligence solutions
to
business reporting solutions
. Even
make life easier on managers solutions
might be more descriptive than
business intelligence solutions
.
■
About a year ago, Randal performed a casual experiment to see how many of his co-workers within the iT
industry understood what the term
BI solution
meant. As he expected, 90% did not know. some guesses were pretty
comical. A favorite was “intelligent robots for businesses.” But many guesses were nothing more than a long string
of verbs in search of a definition. As you might imagine, only about 10% of his co-workers had a problem figuring
out what a reporting solution was.
Note
No matter what you call your BI solution, the most common output is a set of reports that present
meaningful information to your users. You have many reporting tool options from which to choose. In this topic,
we focus on using the most readily available Microsoft technologies to create your BI reports, including Excel and
SQL Server Reporting Services (SSRS).
Deciding what type of data source the reports will use is an important aspect of reporting. A typical pattern
in the industry begins with simple solutions and moves progressively toward more complex ones over time
(outlined in Figure
1-5
).