Hardware Reference
In-Depth Information
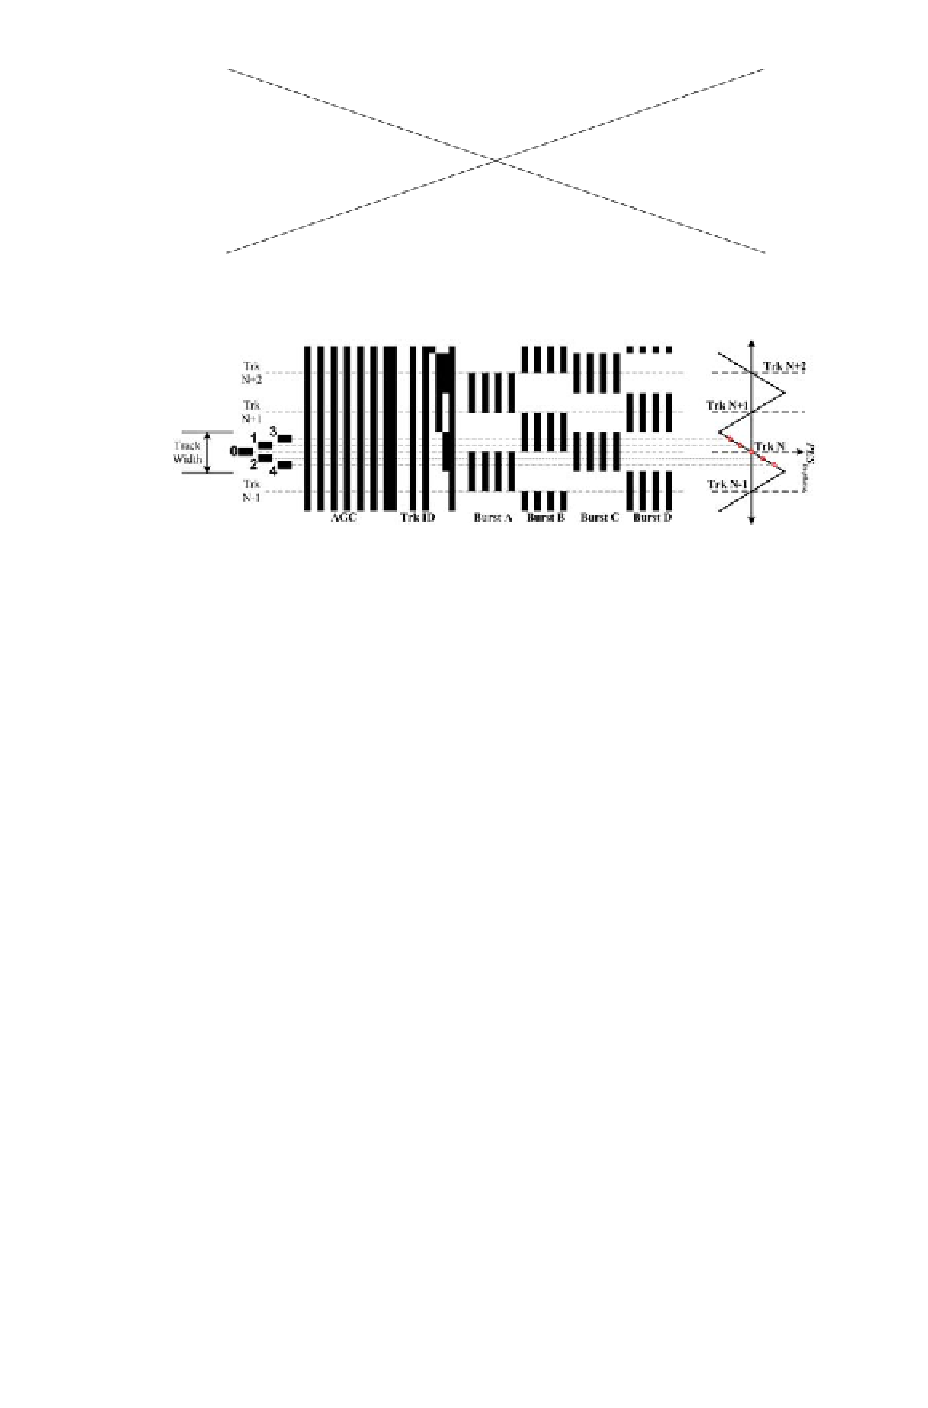
Figure 2.13: Different fields in a servo sector.
Figure 2.14: Illustration of magnetic pattern for servo burst.
displacement of the read head from the center of the track, i.e., the fraction of
track-pitch. The readback waveform generated by the head scanning the PES
burst pattern is decoded to measure the fractional off-track error.
The schematic layout of the magnetic patterns in the servo burst field is
illustrated in Figure 2.14. This represents only a tiny segment of the disk
surface. Shaded and clear segments are used in this figure to differentiate
between areas of the disk magnetized in opposite polarity. Moving from left
to right in this figure or vice versa is equivalent to moving in the direction
along the track, i.e., the down-track direction, and moving up or down is the
cross-track direction. This illustration shows the track-centers of 4 consecutive
tracks with track numbers increasing upward. Definition of the track-centers
will become clear after the following analysis of the signals obtained from these
patterns.
When the read sensor scans a magnetic transition, a voltage pulse is pro-
duced. The polarity of the pulse depends on the type of transition. An example
is shown in Figure 2.15 for two consecutive magnetic transitions. The read-
back waveform shows two similar pulses of opposite polarity. The amplitudes
of the pulses depend on the magnetic flux linking the read head and hence on
the distance of the head with respect to the transitions, both in the vertical
plane as well as on the plane parallel to the disk surface. With the help of this
simple explanation on the amplitude of readback pulse, it is easy to deduce
the readback waveform produced when the read head scans the servo burst
patterns at different cross-track positions.