Hardware Reference
In-Depth Information
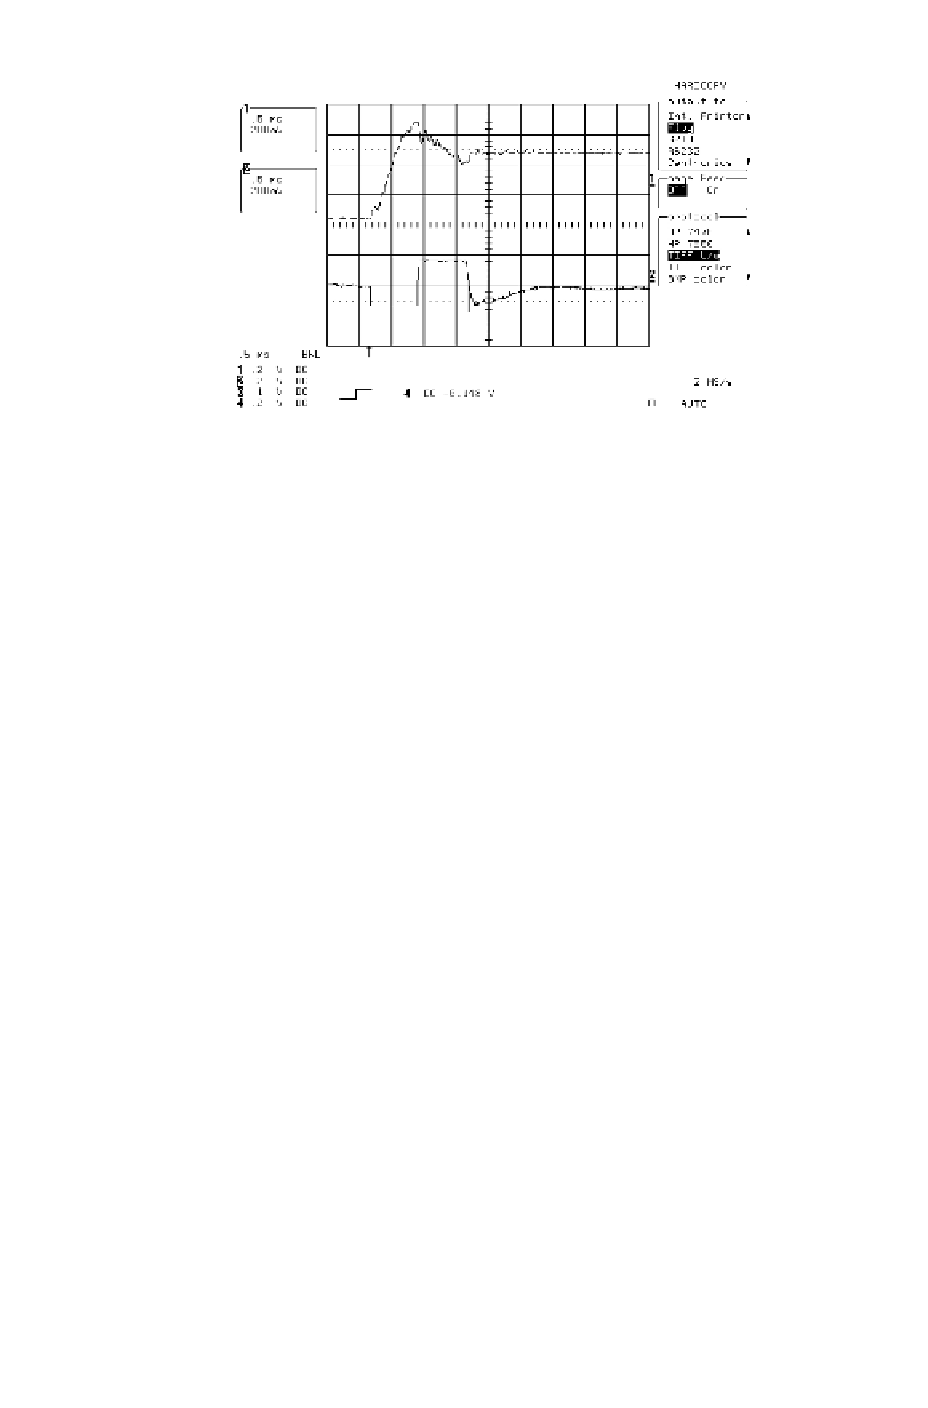
Figure 3.101: Response to 35 µin step input with nonlinear control scheme.
Upper curve: combined output y
p
, lower curve: microactuator control voltage
u
M
.
The effect of secondary stage actuator stroke limitation on system performance
is evaluated in the following experiments by analyzing 3σ (or the 3 times the
standard deviation) of the dual-actuator combined output y
p
.Theexperiment
is repeated with the saturation range of the secondary stage set to different
levels. The combined output y
p
is measured, the data is acquired, and the
standard deviation σ is computed for each of these cases. Figure 3.102 shows
the comparison of 3σ for y
p
with the secondary actuator saturation range set
at ±0.05, ±0.1, ±0.15, ±0.2, ±0.25, ±0.3, ±0.4, ±0.5, and ±0.7 V in this
experiment.
As can be seen from the figure, the 3σ for the nonlinear controller degraded
from 0.5 µin to 1.1 µin when the microactuator control voltage limit reduced
from ±0.7Vto±0.05 V. The linear controller, while achieving the almost
same 3σ of 0.5 µin at a control voltage range of ±0.7 V, could not maintain
the closed-loop stable when the control voltage is reduced to slightly below
±0.05 V.
Evaluation of Robustness
It should be noted that an accurate model of the microactuator is required
for this nonlinear controller to make the estimate of the microactuator output
a true representation of the actual output of the microactuator, i.e., y
M
→
y
M
. Getting an accurate model of any mass-produced actuator is no doubt
a ideal proposition. In reality, the properties of the microactator varies with
environmental conditions and also from sample to sample. In such case, a
natural doubt arises about the effectiveness of the controller - is the proposed