Hardware Reference
In-Depth Information
0.12
0.1
0.08
0.06
0.04
0.02
0
0
500
1000
1500
2000
2500
3000
Frequency [Hz]
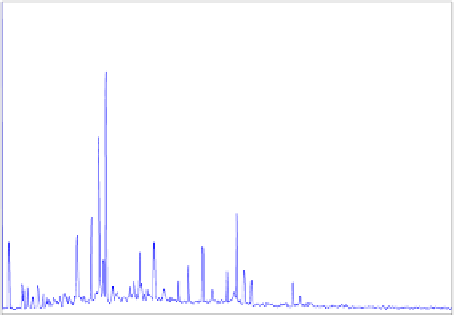
Figure 3.57: Linear spectrum of PES.
transfer function relationship between the vertical vibration velocity and the
PES signal. Instead of using an external excitation source when measuring
thesystem'sfrequencyresponse,wecanusediskflutter velocity (with the
repeatable part removed) as the input signal and the PES as the output of the
system to be modeled. Table 3.4 shows the amplitude and phase differences,
obtained from the DSA, between the dominant modes of PES and the disk
flutter measured.
0.6
0.4
0.2
0
−0.2
−0.4
−0.6
0
0.005
0.01
0.015
0.02
0.025
Time (second)
Figure 3.58: Time domain signal of disk vertical vibration velocity (dashed-
line) and the PES (solid line).
Figure 3.59 shows the closed-loop system sensitivity transfer function mul-
tiplied by an integrator (solid curve) and the points, marked with asterisks (*),
corresponding to Table 3.4. From this figure, we see good match between the
phases and also between the magnitudes of the first four dominant modes.
These results confirm that the disk vertical vibration is proportionally re-
flected in the in-plane positioning error. As such, we can modify the standard