Hardware Reference
In-Depth Information
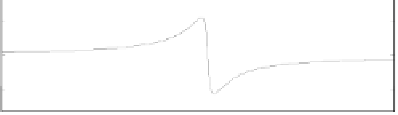
M
N
0
f
p
(1-
∆
)
f
p
(1+
∆
)
0
θ
f
p
Frequency
Figure 3.27: Frequency response of a peak filter.
100
50
0
−50
−100
10
0
10
1
10
2
10
3
10
4
10
5
10
6
0
−100
−200
−300
10
0
10
1
10
2
10
3
10
4
10
5
10
6
Frequency (rad/s)
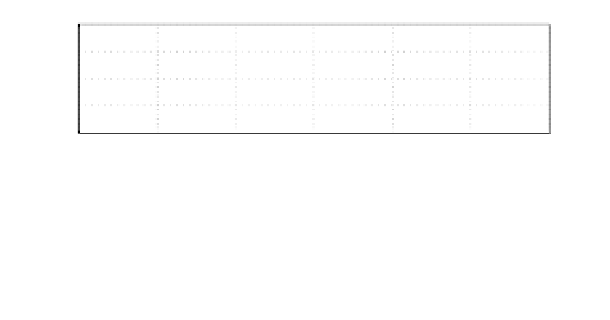
Figure 3.28: Open loop frequency response. Solid line: PID-type controller +
notch filter + peak filter. Dashed-line: PID-type controller + notch filter.
loop transfer function at the frequency of disturbance means better rejection
of this periodic disturbance. The bode plot of the sensitivity transfer function
is shown in Figure 3.29 along with the sensitivity transfer function obtained
using PID-type controller and notch filter.
The step response shown in Figure 3.30, however, exhibits more oscillatory
behaviour for the controller with peak filter included compared with the case
when no peak filter is used.
Thediscretetransferfunctionofthepeakfilter (3.29) can be obtained by
substituting s =
T
1
−
z
−
1
1+z
−
1
:
−2
1+Ez
−1
+ Fz
−2
,
−1
+ Cz
C
p
(z)=
A + Bz
(3.31)