Environmental Engineering Reference
In-Depth Information
74% are evaluated, respectively, with an overall efficiency value for the power
train of about 27%.
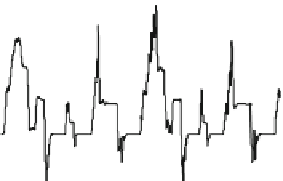
The next experiment is performed increasing the slope of the acceleration
phases of the same R40 cycle, in order to obtain current variations of 10 A s
-1
,
and maintaining the same air management strategy of Fig.
7.56
. The results of this
experiment are shown in Fig.
7.57
, where the power distribution between engine,
battery pack, and DC-DC converter is reported versus the cycle length. For this
cycle a different control strategy is adopted, based in particular on the fact that all
power requirements from the electric drive are mainly satisfied by the FCS already
at the start up, while the contribution of batteries is limited to about 30% of the
power demands during the acceleration phases. This strategy is chosen according
to the soft hybrid option, aimed to minimize the intervention of the energy storage
devices. The results of Fig.
7.57
clearly show that the dynamic behavior of the
FCS permits the energy requirements from the engine to be instantaneously
Fig. 7.57 Power distribution
between FCS, electric engine,
and batteries as function of
cycle length for R40 cycle at
10 A s
-1
as stack current
variation rate (soft hybrid
configuration)
15
FCS Power (DC-DC OUT)
Battery Power
Elec. Drive Power
10
5
0
-5
0
50
100
150
200
Time [s]
Fig. 7.58 Power distribution
between FCS, electric engine,
and batteries as function of
cycle length for three suc-
cessive R40 cycles at
50 A s
-1
and DC-DC output
power constant at 5 kW (hard
hybrid configuration)
50
FCS Power (DC-DC OUT)
Battery Power
Elec. Drive Power
40
30
20
10
0
-10
-20
0
100
200
300
400
500
600
Time [s]