Environmental Engineering Reference
In-Depth Information
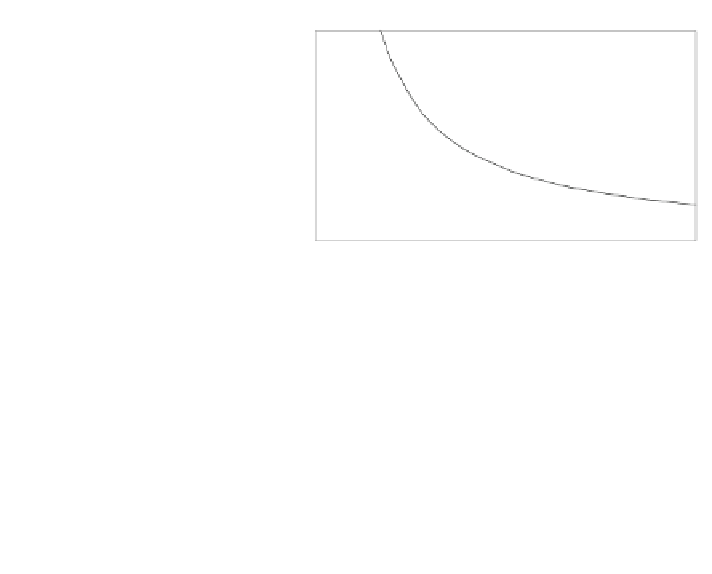
Fig. 7.40 a Stoichiometric
ratio versus stack current for
four different management
strategies. b Air flow rate
versus stack current for the
management strategies (a)
a
12
law 1 (Qair 33 m3/h)
law 2 (Qair 24 m3/h)
law 3
law 4
10
8
6
4
2
0
0
40
80
120
160
200
Stack Current , A
b
35
30
25
20
15
law n.1
law n.2
law n.3
law n.4
10
5
0
0
20
40
60
80 100 120 140 160 180 200
Stack Current, A
from 1.5 to 2 V (60 A as stack current), then after a constant phase at 2 V the
voltage reference is linearly increased up to 4 V in the range 110-200 A of the
stack current. This last management strategy allows the compressor consumption
to be minimized with R values such as to guarantee a regular stack operation in
steady state operations.
The study of the effects of compressor management strategy on the efficiencies
of stack and subsystem (SC) composed by stack and compressor is preliminarily
carried out in steady state conditions. In particular, the stack efficiency (g
stack
)is
calculated by using the Eq.
7.1
starting from the data obtained at 313 K with the
compressor management curve 4 (Fig.
7.40
a, b) and reported in Fig.
7.41
as
function of stack current. A linear trend can be observed in the range 30-200 A
corresponding to an efficiency decrease from 0.7 to 0.5. The g
stack
curves for the
other management strategies are not reported because they are not significantly
affected by R [ 2. In Fig.
7.41
, g
SC
(Eq.
7.3
) is also reported for all the different
compressor management strategies of Fig.
7.40
a.
Differently from stack efficiency the g
SC
values are clearly dependent on the
profile of R utilized, due to compressor consumptions connected to different motor
speed regulations. In particular, highest g
SC
values decrease from 0.60 to 0.53
passing from management curve 4 to 1, with major differences in the field of lower
loads (under 100 A).