Environmental Engineering Reference
In-Depth Information
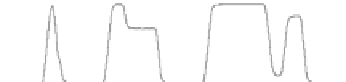
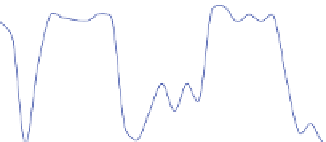
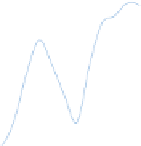
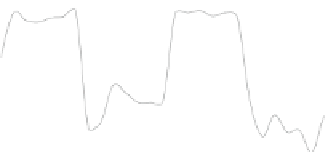
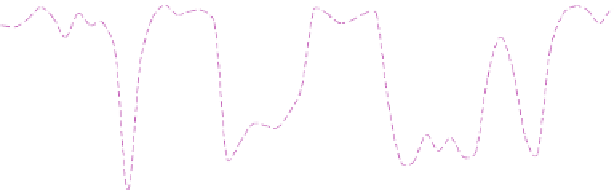
Fig. 7.23 Stack voltage and
current versus time for a
dynamic test at 50 A s
-1
based on the R40 cycle
80
700
70
600
60
500
50
400
40
300
Stack Voltage
Stack Current
30
200
100
20
25
0
10
50
100
150
200
Time [s]
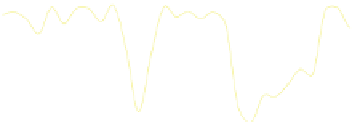
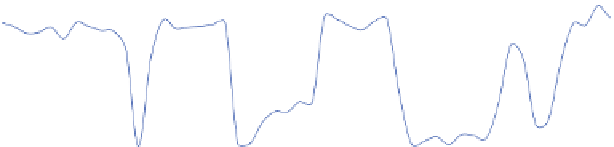
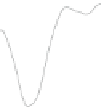
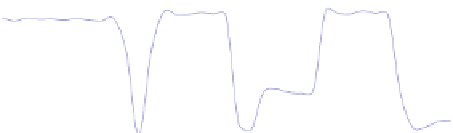
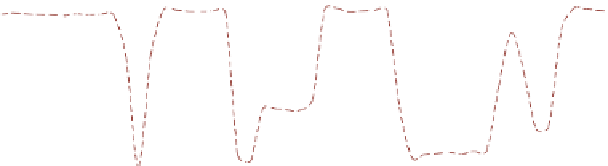
Fig. 7.24 Stoichiometric
ratio and air flow rate versus
time for the experiment of
Fig.
7.23
100
3.5
90
3
80
2.5
70
60
2
50
1.5
Stoichiometric Ratio
Air Flow Rate
40
1
30
20
0.5
10
0
50
100
150
200
250
Time [s]
1
0.9
0.8
0.7
0.6
0.5
0.4
0.3
0.2
0
50
100
150
200
250
Time [s]
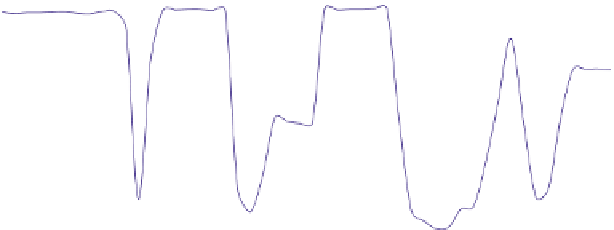
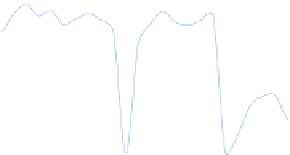
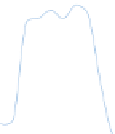
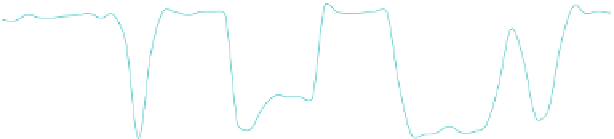
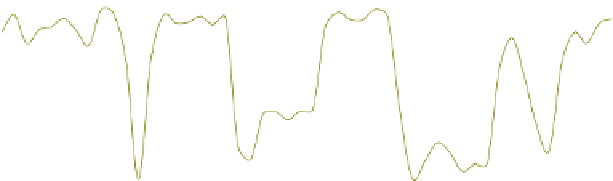
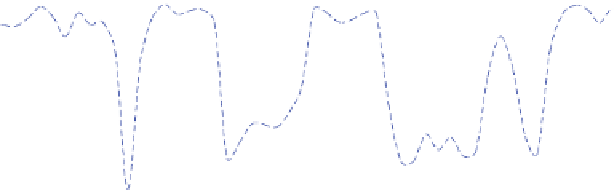
Fig. 7.25
Individual cell voltage acquisition versus cycle length during the experiment of Fig.
7.23