Environmental Engineering Reference
In-Depth Information
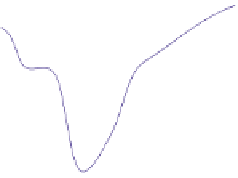
Fig. 7.21 Individual cell
voltage acquisition versus
cycle length during the
experiment of Fig.
7.19
1
0.9
0.8
0.7
0.6
0.5
0.4
0.3
0.2
0
5
10
15
20
25
Time [s]
0.8
0.7
0.6
0.5
0.4
0.3
0.2
0.1
0
1 4 7 101316192225283134374043464952555861646770737679
Cell Number
Fig. 7.22 Individual cell voltage acquisition during the experiment of Fig.
7.19
at the instant of
maximum acceleration (t = 10 s, 220 A)
in the experimental condition adopted (12 kW with respect to 25 kW required by
the cycle). For this test the air management strategy is modified, increasing the air
flow rate in the range 0-200 A (see
Sect. 7.4
).
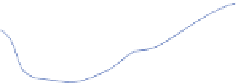
In Fig.
7.23
, the stack current and voltage is reported as function of cycle
length, while Fig.
7.24
shows the corresponding R and air flow rate for the
modified air management strategy. The voltage profile results acceptable for the
whole cycle, with values never lower than 47 V, while R values does not decrease
under 1.8 also during the fastest acceleration phases.
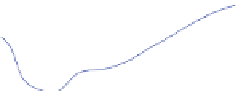
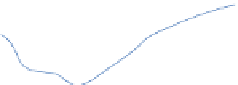
The analysis of the results obtained for the individual cells (Figs.
7.25
and
7.26
)
confirms the benefit of the new air management strategy on the stack dynamic
behavior, in particular most cells show a regular operation in the whole load range,
while only for some cells a significant voltage reduction is observed at the end of
the acceleration phases, with a partial voltage recovery during the stationary