Environmental Engineering Reference
In-Depth Information
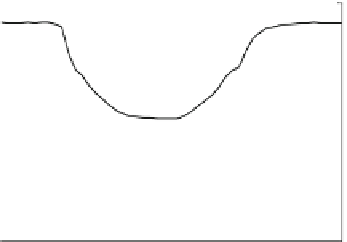
Fig. 7.19 Stack voltage and
current versus time for a
dynamic test at 50 A s
-1
80
500
70
Stack Voltage
Stack Current
400
60
50
300
40
200
30
100
20
0
10
0
5
10
15
20
25
Time [s]
Fig. 7.20 Stoichiometric
ratio and air flow rate versus
time for the experiment of
Fig.
7.19
80
3
70
2.5
60
2
50
Stoichiometric Ratio
Air Flow Rate
1.5
40
1
30
0.5
20
10
0
0
5
10
15
20
25
Time [s]
together with the total stack voltage. This voltage drops down from 71 to about
45 V at the end of the acceleration step, then remains constant during the sta-
tionary phase (5 s), and rise again during the deceleration step. The R and air flow
rate profiles, reported in Fig.
7.20
, evidences that the compressor operation is
stressed by the high dynamic adopted, in particular the faster dynamic of this test
determines an appreciable effect on the stoichiometric ratio, whose profile
decreases below 1.5 at the end of the acceleration phase. This behavior is further
evidenced in Figs.
7.21
and
7.22
, where the individual cell voltages are plotted as
function of cycle length and as histogram acquired at the instant corresponding to
the highest current peak, respectively. A problem of stack malfunctioning is
clearly evidenced for several cells, in particular the first one dropped under 0.3 V,
while the other three cells among the last 20 did not reached 0.4 V. The reason for
this behavior is attributed to difficulties of the air compressor in supplying the right
values of stoichiometric ratio (Fig.
7.20
), and this suggests to change the air
compressor strategy in order to increase R values during the fastest dynamic
phases. Figures
7.23
,
7.24
,
7.25
, and
7.26
show the results of a test on the R40
cycle operating at 50 A s
-1
during the acceleration phases, but modified regarding
the maximum power, which is limited to the optimal power obtainable by the stack