Environmental Engineering Reference
In-Depth Information
Fig.
7.15
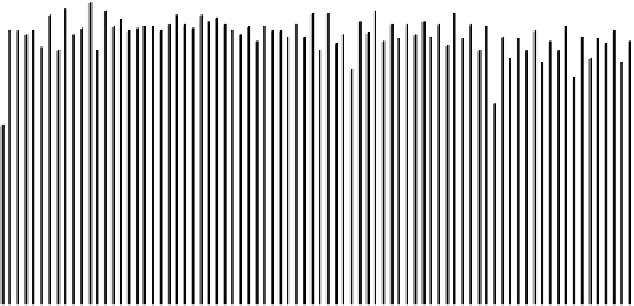
for the instant corresponding to 240 A. In particular, it can be noticed
that the voltage of most cells is close to 0.6 V, while only a voltage decreases
between the first cell (about 0.4 V) and the last group of 20 cells (values of voltage
comprised between 0.45 and 0.55 V for few cells is measured). As expected, the
behavior of these cells results better for all the other values of current. Since no
cell decreased under 0.4 V during the test, it means that the dynamic considered is
satisfactorily supported by the FCS for the cycle utilized.
The data for the R40 cycle is then modified to obtain acceleration phases of
10 A s
-1
, and another experiment is carried out on this cycle according to the
target of minimizing the compressor consumption. The results of this test are
0.8
0.7
0.6
0.5
0.4
0.3
0.2
0.1
0
1 4 7 101316192225283134374043464952555861646770737679
Cell Number
Fig. 7.15
Individual cell voltage acquisition during the experiment of Fig.
7.14
at t = 170 s
(240 A)
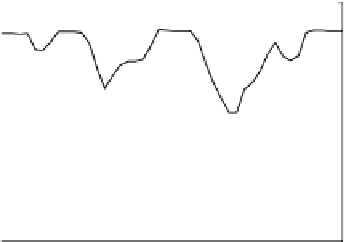
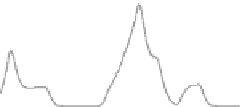
Fig. 7.16 Stack voltage and
current versus time for a
dynamic test at 10 A s
-1
based on the R40 cycle
80
500
70
400
60
300
50
Stack Voltage
Stack Current
40
200
30
100
20
10
0
700
750
800
850
900
Time [s]