Environmental Engineering Reference
In-Depth Information
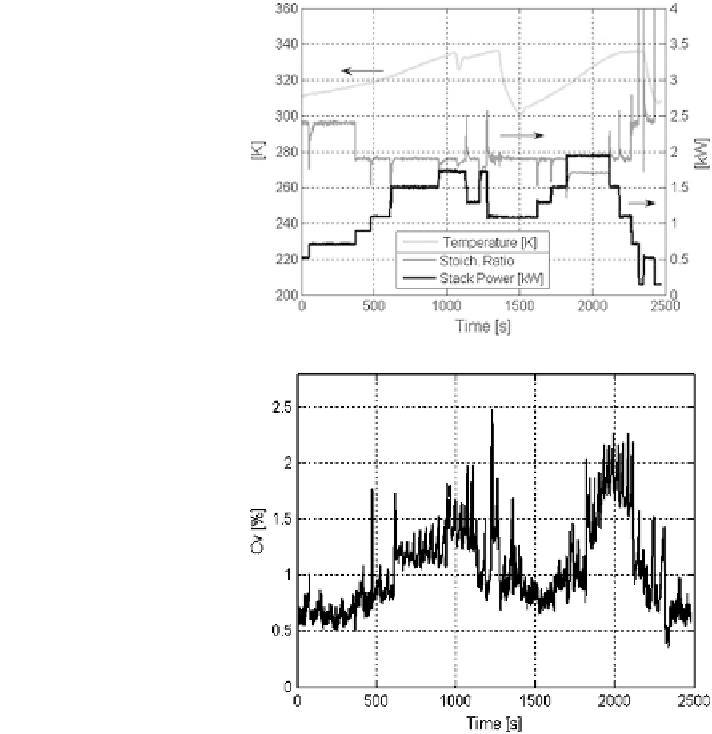
Fig. 6.11 Acquisition of
temperature, stoichiometric
ratio, and power versus time
for the fuel cell system during
different steps of stack power
variations
Fig. 6.12 Coefficient of per-
centage variation (C
v
) versus
time of individual cell voltage
for the experiment of Fig.
6.9
This implies a spontaneous stack heating characterized by an initial temperature
increase rate of 1.5 K/min, which becomes 2.5 K/min for a stack power higher
than 1 kW. The stoichiometric ratio, following the relation reported in Fig.
6.5
,
reduces rapidly from 2.4 to 1.7 during the acceleration phases. The coefficient of
variation C
v
results much less than 2% in the range of time considered, indicating
an acceptable regularity of stack working (Fig.
6.12
). The function of the hydrogen
purge is highlighted in Fig
6.13
showing the individual cell voltages with the
relative pressure of hydrogen measured at anode inlet for the total acquisition time.
Moreover, it is possible to observe that the drops of hydrogen pressure, due to the
purge action, are followed by a voltage recovery for those cells more affected by
flooding phenomena. This behavior is more evident at the highest loads and tem-
peratures, as confirmed during the second phase of the experiment (Figs.
6.11
,
6.12
).
In fact, after cooling from 335 K (1356 s) to 300 K (1510 s), obtained switching
on the external water circuit of the heat exchanger, a steady-state condition at
2 kW with stoichiometric ratio of 1.7 is reached in a time window of 300 s