Environmental Engineering Reference
In-Depth Information
1
2
3
4
5
6
7
97
66
45
31
21
14
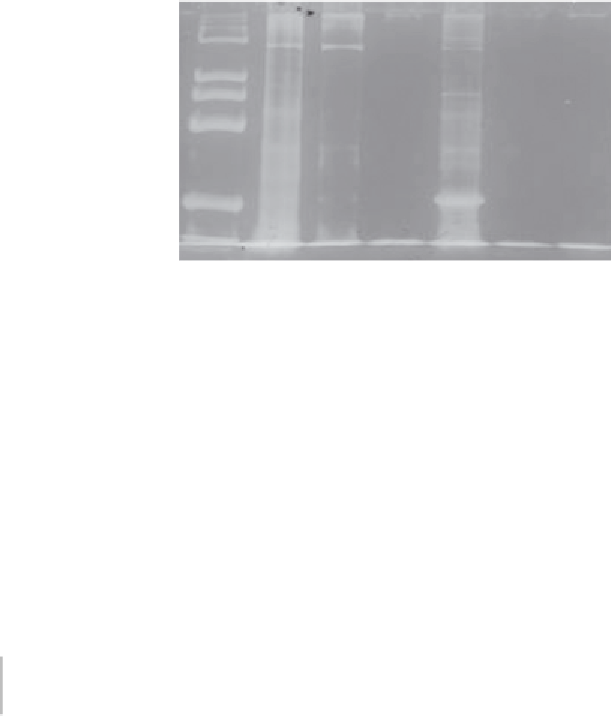
Figure 4.4
SDS PAGE analysis of the barnacle adhesive cement stained with silver
staining. Lane 1: Molecular weight markers (Bio-Rad Laboratories), the numbers
on the left-hand side indicate molecular masses (kDa). Lane 2: Barnacle cement
protein (BCP) from GdnHCl-soluble fraction 2 (GSF2) showing 100 and 38 kDa.
Lane 3: BCP from GSF2 showing 100 kDa protein band. Lane 4: BCP from a
basal plaque with a base plate subjected to decalciication. Lane 5: Fresh barnacle
cement from barnacles attached to mussels showing 100, 45, 38 and 19 kDa
protein bands in which the 19 kDa protein is brighter and of higher concentration
than the others. Lanes 6 and 7: Cement collected from the basal plate of barnacles
attached to substrates. GdnHCl: guanidine hydrochloride
Table 4.6 Difference in the molecular weights (kD) of barnacle cement
proteins observed on PMMA (P-C) and Mussel Shell (RC and MSP-C)
A. reticulates
B. amphitrite
M. Rosa
E. Eburneus-
RC
P-C
MSP-C
P-C
P-C
P-C
23
21
19
25
20
22
33
33
46
28
47
36
65
58
62
32
57
52
85
65
66
38
60
58
108
81
81
52
68
80
−
85
85
68
100
−
−
93
88
80
180
−
−
102
93
90
−
−
−
103
100
−
−
−
−
115
125
−
−
−