Geology Reference
In-Depth Information
1
0
0
3
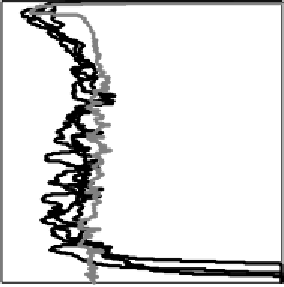
Tracer concentration
Figure 10.18. Profiles of concentration of basaltic tracers. The black profiles are
from evolving models at the end of the run, including the models of Figures 9.5
and 9.10 and Case 1 from Davies [156]. The grey profile is from the steady model
'Coolr' from Davies [123].
is established, it will heat up and its viscosity will be much lower than the overlying
mantle, which would make entrainment of the accumulation harder. Therefore the
accumulation persists into the present, even though it could not form now. It is
not clear why the upper-mantle gradient should persist into the present, because
subduction should keep the upper mantle well connected and stirred with the lower
mantle.
Thus the evolving models indicate that some mechanical depletion of the upper-
most mantle may occur. This would mean that the concentrations inferred from
melting under mid-ocean ridges were lower than in the deeper mantle. The effect
could require the mean mantle trace element composition to be revised upwards by
as much as a factor of 2, though there is still some uncertainty about the magnitude
of the effect.
10.7 Dynamical modelling of refractory incompatible elements
The observations summarised in Section 10.1 establish four things about the refrac-
tory incompatible elements in the mantle. First, there is a significant degree of
heterogeneity in both trace elements and isotopes. Second, OIBs are distinctly
more enriched and more heterogeneous than MORBs (Section 10.3). Third, both
populations reveal an apparent age of about 1.8 Ga in the lead isotope plot
(Figure 10.3(a)). Fourth, there is no clear evidence for a primitive component.
The mantle abundances of heat source and other trace elements inferred in
Section 10.2 are consistent both with global budgets of refractory elements and with