Geology Reference
In-Depth Information
600 Myr
1500 Myr
2000 Myr
4500 Myr
0.0
1800.
0.0
10.0
Temperature
tracer concentration
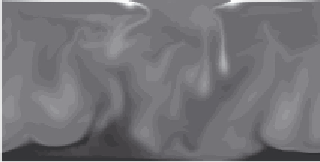
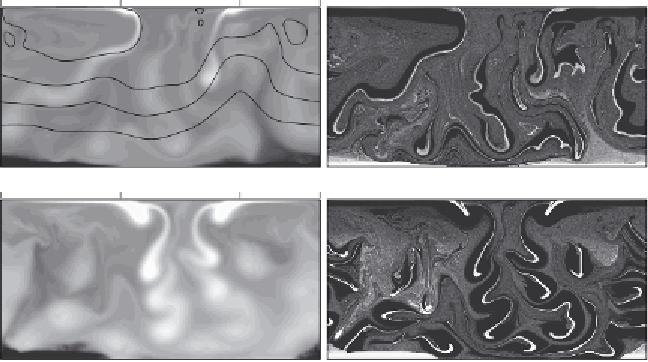
Figure 9.5. Temperature and streamlines (left) and tracer concentrations (right)
from a numerical model with tracers that represent subducted basaltic crust that is
denser than average mantle by 150 kg/m
3
. A tracer concentration of 1 corresponds
to the average basaltic content of the mantle. White zones at the top are melting
zones from which tracers have been removed to the oceanic crust.
9.4.1 Four billion years of basalt subduction
We will start by looking at the effect of subducted oceanic crust being (mostly)
denser than surrounding mantle. Results from a numerical model are shown in
Figure 9.5. The model represents oceanic crust (at the surface or within the mantle)