Geology Reference
In-Depth Information
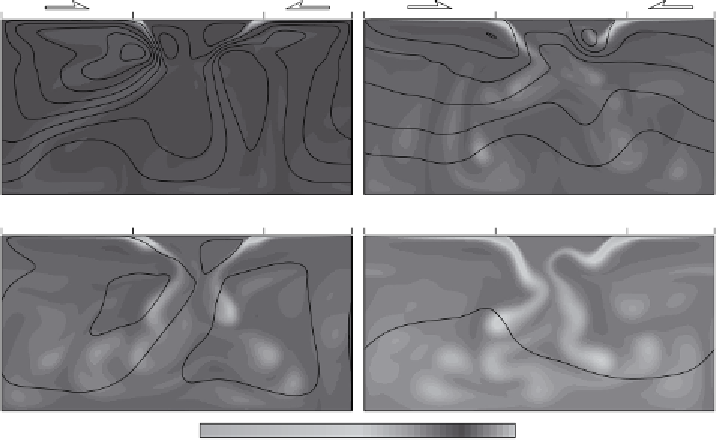
600 Myr
1500 Myr
2000 Myr
4500 Myr
0.0
1800.
Temperature
Figure 9.3. Temperature and flow field at selected times from the evolution shown
in Figure 9.2. Temperature is shown in the grey scale (only in the 600 Myr panel
of this model is there any fluid, under the plates, hotter than the palest grey). The
flow field is represented by streamlines, which are the flow lines for that moment.
The surface has three plates, two outer oceanic plates subducting under the central
continental plate. Their motions are indicated by the arrows. The continental
lithosphere is excluded from this model, so the middle section of the top surface
corresponds to the base of the continental lithosphere.
are short-term fluctuations in the upper-mantle temperature that reflect the higher
velocities there, and also the vagaries of how quickly the subducted lithosphere
sinks into the lower mantle. These fluctuations are also closely reflected in the heat
loss (panel (b)). The mean mantle temperature, on the other hand, varies much
more smoothly, as it responds to the time-integrated heat loss.
9.3 The heat source puzzle
The calculations in the previous sections implicitly assume that there is sufficient
radioactive heating to sustain the present mantle heat loss, allowing for the fact that
the mantle is cooling. At the end of the parametrised run, the heat loss is 36.4 TW,
whereas the radiogenic heating is 24.6 TW (Section B.2). Thus the Urey ratio is
0.68. In other words, 68% of the surface heat loss is supplied by radiogenic heating.