Geology Reference
In-Depth Information
3
ak135
β, α
ρ
[Mg/m ]
[km/s]
2
4
6
8
10
12
14
0
1000
2000
3000
4000
5000
β
α
ρ
6000
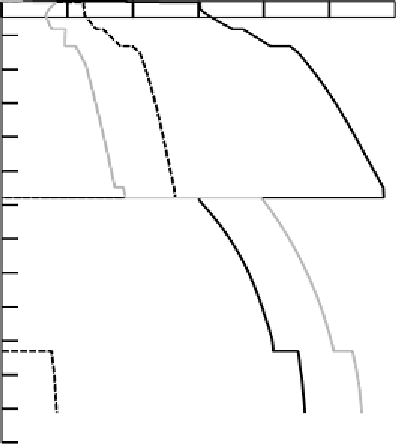
Figure 2.1. Variation of properties with depth in the Earth, defining crust, mantle
and core. Profiles are of the seismic compressional velocity, α (solid black), shear
velocity, β (dashed black), and density, ρ (solid grey). Curves from the model
ak135. Figure courtesy of Kennett
et al.
[2, 3].
some lighter elements. The inference of iron and nickel comes from meteorites,
some classes of which are made of an iron-nickel alloy.
The boundary between the crust and the mantle is barely discernible in
Figure 2.1, because the crust is so thin on this scale, as will be discussed below.
There are two jumps within the mantle, at depths of 400 km and 660 km. These
define the
transition zone
, and are the locations of pressure-induced phase trans-
formations, where the mantle minerals collapse into denser crystal structures. The
transition zone may have played a large role in determining the form of mantle
convection early in Earth's history. For many years there was also a major debate
about whether the 660 km jump separated convection in the upper mantle from
convection in the lower mantle, but there is strong evidence now that convection
passes through the transition zone in the modern Earth. This will be discussed in
later chapters.
Also visible in Figure 2.1 are changes in the bottom 200-300 km of the mantle.
These changes are not well resolved in this model, but other seismic studies have
clearly identified changes in seismic velocity and in some places discontinuities.
This zone is known as the D
region, terminology left over from early studies of