Geology Reference
In-Depth Information
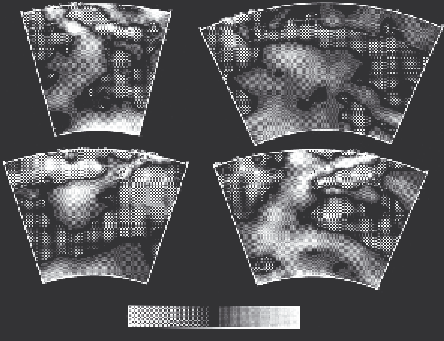
(a)
(c)
(b)
(d)
−
1.0%
+1.0%
slow
fast
Figure 8.5. Profiles through seismic tomography models of subduction zones:
(a) Aegean, (b) Tonga, (c) Central America and (d) Japan. The shading shows
variations in the shear wave velocity. Small circles show earthquake locations.
From the model S_SKS120 of Widiyantoro [116].
the few data with a putatively primitive signature were probably contaminated
by continental crust, but the idea of a primitive lower mantle rapidly became
entrenched, in spite of the slender evidence supporting it, and in the face of clear
and well-known contrary evidence from lead isotopes [115]. The geochemical
issues will be taken up again in Chapter 10.
There are two strong arguments against a separation of convection at 660 km
depth, one well known, the other less well known but relevant to subsequent
versions of layering. The well-known evidence comes from seismic tomography,
and shows zones of high seismic velocity reaching from surface subduction zones
well down into the lower mantle (Figure 8.5). These zones are readily interpreted
as subducted lithosphere penetrating through the 660 km level and deep into the
lower mantle.
The mass flux associated with subducted lithosphere penetrating into the lower
mantle rules out any long-term compositional difference between the upper and
lower mantles. Lithosphere subducts at a rate of about 3 km
2
/yr, has a density
of about 3300 kg/m
3
and is about 100 km thick. This amounts to a mass flow of
10
15
kg/yr. The lower mantle contains about two-thirds of the mass of the mantle,
so its mass is about 2.6
10
24
kg. This means that it takes about 2.6 Gyr to replace
the lower-mantle material, at present rates of subduction, and the rates are likely to
have been greater in the past, as we will see in Chapter 9. This implies that the lower
mantle cannot be chemically isolated from the upper mantle. Some have proposed
×