Geology Reference
In-Depth Information
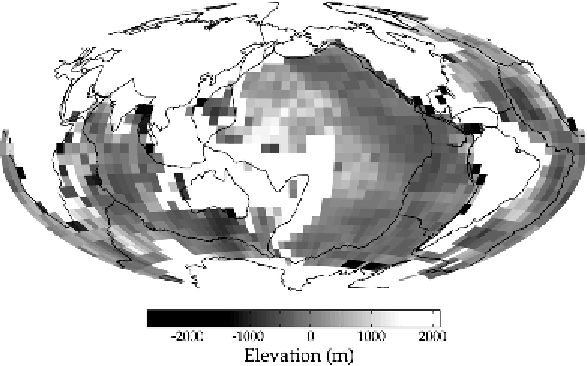
Figure 8.4. Anomalous seafloor topography. An age correction (with a subsidence
rate of 320 m/Ma
1/2
) and a correction for crustal thickness using the 5
◦
×
5
◦
grid
of Mooney
et al.
[100] have been removed. Figure courtesy of S. V. Panasyuk,
Harvard University [101].
Pribac [91] in 1993. The idea of asymptotic flattening arose from early, limited
depth and heat flow data that seemed to show a levelling-off for sea floor older
than 70 Ma [99], and it was interpreted in terms of oceanic plates that approach
a limiting thickness of about 100 km. If, however, the old sea floor merely shows
regional positive depth anomalies, the implication is that plates normally continue
to thicken with age, and that some deeper source of buoyancy slows or reverses
their subsidence in some regions.
Davies and Pribac pointed out that there are long-wavelength variations in the
depths of mid-ocean ridge crests by hundreds of metres, with a maximum of about a
kilometre. These can be seen in Figure 2.4; particularly notable is the low elevation
of the ridge between Australia and Antarctica, which is about 1 km deeper than
normal. These obviously are not due to variations in lithosphere age (it is all age
zero), nor are they due to variations in crustal thickness. The only possibility is
that they are due to long-wavelength variations in the mantle, plausibly of mantle
temperature. A few tens of degrees variation for some hundreds of kilometres depth
is sufficient to account for the depth variations.
Some such variations are expected just because the temperature variations due
to lithosphere subduction take a long time to be homogenised. If such variations
exist under ridge crests, they should be expected elsewhere as well. Therefore, we
should expect long-wavelength deviations from square root of age subsidence with
amplitudes of hundreds of metres. Just such deviations exist, as is illustrated in
Figure 8.4.