Agriculture Reference
In-Depth Information
5
10
15
20
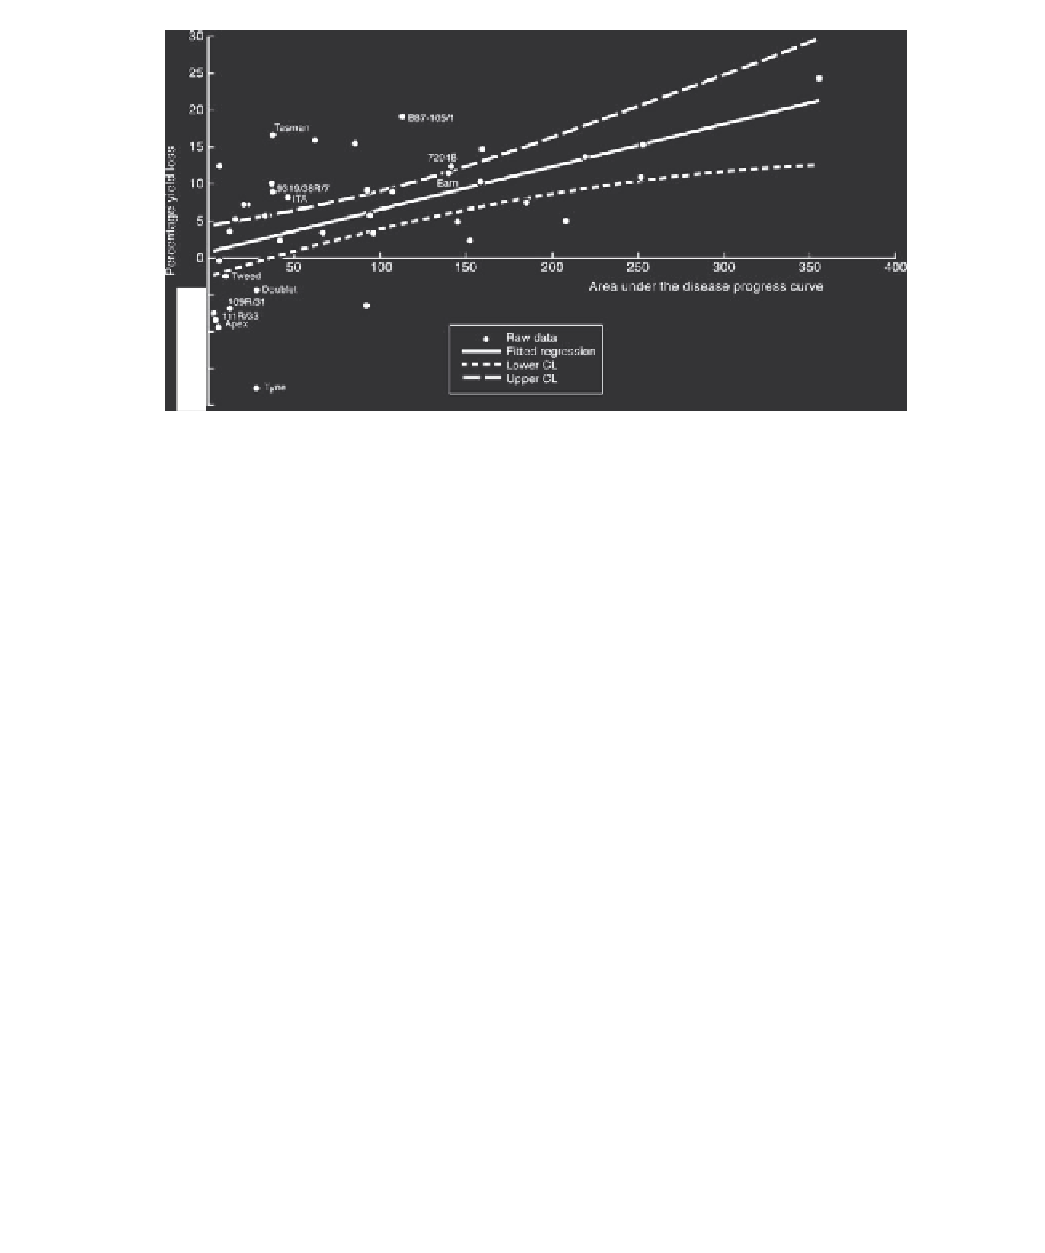
Figure 7.2
Relationship between yield loss and area under the disease progress curve for spring barley
cultivars. Data points that fell more than one standard deviation outside the fi tted line were considered
tolerant or non-tolerant (after Newton
et al.
, 1998; with permission from Elsevier).
Several reports have suggested that tolerance may have low heritability, with its
expression depending strongly on the prevailing climatic and edaphic conditions. Thus,
the relative tolerance of spring barley cultivars to leaf rust measured in a two-year
study differed between years (Kramer
et al.
, 1980). Similarly, spring barley genotypes
designated as tolerant of powdery mildew infection varied between years and fertilizer N
treatments (Newton
et al.
, 1998, 2000). Part of the variation may arise from the practice
of estimating AUDPC in terms of the percentage leaf area occupied by visible disease
symptoms scored on a whole plant basis, rather than absolute area, as it provides no indi-
cation of the reduction in potential radiation interception resulting from infection. Also,
estimates of disease severity on their own do not account for variation between crops
in the amount of remaining healthy leaf tissue. The relationship between canopy size
and radiation interception is non-linear, thus a given loss of green area through disease
may reduce radiation interception more in a small canopy than a large one depending on
the disease distribution. Since canopy size is sensitive to soil, climatic and agronomic
factors, it is not surprising that relative tolerance also appears to vary with these same
factors. To overcome this problem and to provide a more robust estimate of genotypic
variation in tolerance, some authors have quantifi ed tolerance from the slope of the rela-
tionship between healthy leaf area duration (HAD) and yield (Parker
et al.
, 2004; Foulkes
et al.
, 2006). This approach can be extended by quantifying tolerance from the slope of
the relationship between healthy area radiation interception and yield. There are numer-
ous examples of where predictions of disease-induced yield loss based on estimates of
HAD or healthy area radiation interception have proved to be more robust across sites
and years than those based on percentage AUDPC scores (Johnson, 1987; Waggoner
& Berger, 1987; Madden & Nutter, 1995). However, the approach has some disadvan-
tages; fi rstly, it is time-consuming, thereby limiting the number of genotypes that can be
examined, and secondly, some potentially useful tolerance traits may not be identifi ed,