Graphics Programs Reference
In-Depth Information
◗
10.
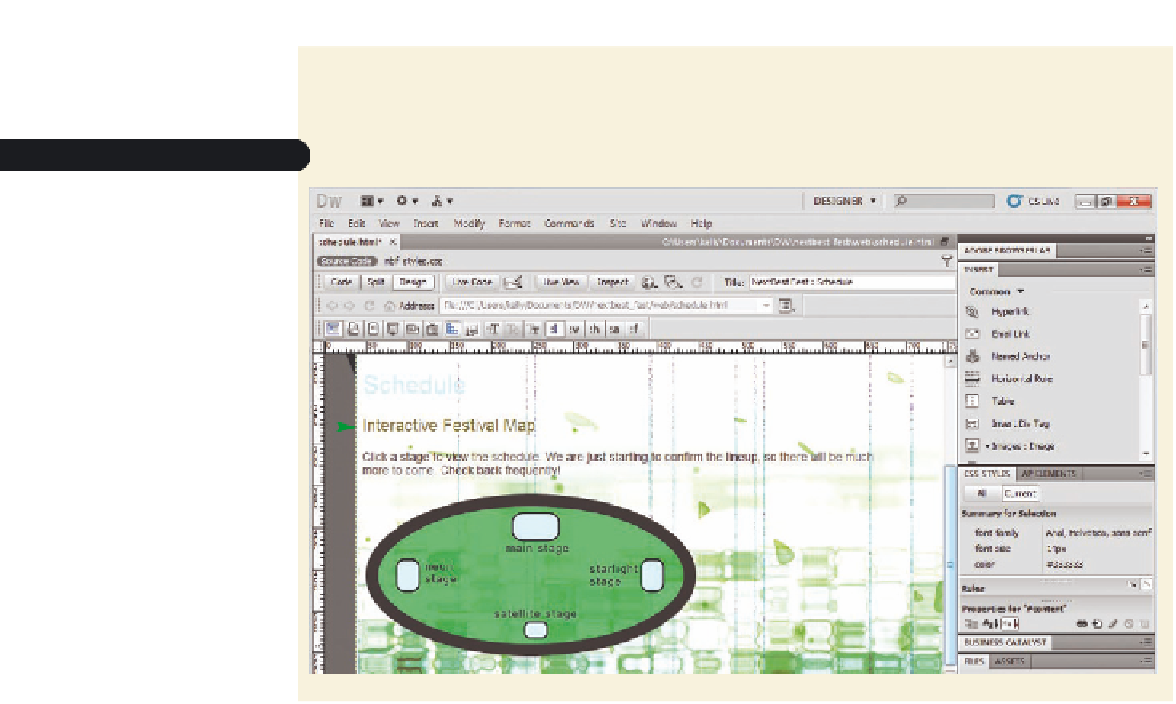
Deselect the graphic, if necessary. See Figure 5-19.
Figure 5-19
Map graphic added to the schedule.html page
heading formatte
d
as h2
festival map
Next, you'll add hotspots to the map, which turns the graphic into an image map.
You want to create a hotspot for each stage on the map. You'll use a rectangle hotspot
because the stages are fairly rectangular in shape. You should draw the hotspot slightly
larger than the object you want users to click to be sure that the area is completely
covered by the hotspot. You will add alt text to each hotspot so that assistive devices can
convey the purpose of the hotspots.
To create the image map from the festival map:
◗
1.
In the Document window, select the
fest_map
graphic.
◗
2.
In the Property inspector, click in the
ID
box, and then type
fest_map_im
.
◗
3.
In the Property inspector, click the
Rectangle Hotspot Tool
button
. In the
Document window, the pointer changes to
.
◗
4.
In the Document window, click just outside the upper-left corner of the main
stage and drag to just outside the lower-right corner to draw a hotspot that cov-
ers the stage. A dialog box opens, prompting you to add alt text for the hotspot.
You can move or resize a
hotspot using the pointer
hotspot tool. If the hotspot
is a polygon, you can move
individual points as well.
◗
5.
Click the
OK
button, and then, in the Alt box in the Property inspector, type
Main
stage with hotspot linking to the schedule below
. See Figure 5-20.


Search WWH ::

Custom Search