Chemistry Reference
In-Depth Information
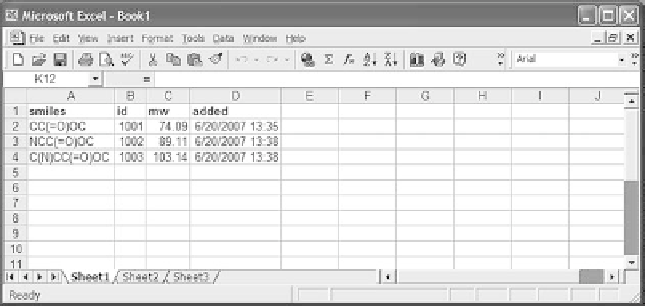
Figure 5.4
Excel spreadsheet with selected data.
process an SQL request for data from a table. This opens a dialog window
by which the user selects columns and rows from tables in the database. It
is also possible to have saved queries that users can select. In either case, the
rows and columns of data are inserted into the Excel spreadsheet. Figure 5.4
shows the results in Excel after selecting the desired columns. Once this
data is available in Excel, any further operations or formatting is possible.
Another useful client program is R.
6
It is used for statistical analysis of
data and has some nice graphical capabilities as well. There is an add-on
to R that uses ODBC to communicate with an RDBMS server.
7
Consider
the following R program.
require("RODBC");
channel = odbcConnect("PostgreSQL30", uid="reader", pwd="something");
sql = "Select logp, xlogp From xlogp.test_set";
df = sqlQuery(channel, sql, max=0);
plot(df);
When this is run, the plot shown in Figure 5.5 is produced. With virtually
no programming other than a simple SQL statement, a plot of two col-
umns of data from a table can be produced using R. Of course, once this
data is read into an R dataframe, many other complex statistical opera-
tions can also be performed. Some of these are discussed in Chapter 12.
Many other useful client programs allow input of data using SQL. For
example Spotfire8
8
and Pipeline Pilot
9
allow data to be read for an RDBMS
using ODBC.
5.5 SQL Interfaces in Various Languages
When developing a client application, one or more computer languages
will be chosen. The purpose of this section is not to advocate one language
Search WWH ::

Custom Search