Environmental Engineering Reference
In-Depth Information
7
6
5
4
3
2
1
0
00
01
02
03
04
05
06
07
08
09
10
11
12
13
14
15
16
17
18
19
20
21
22
23
00
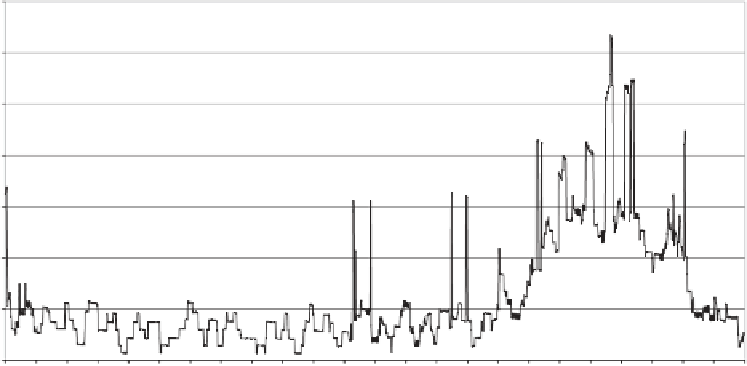
Time (hours)
Figure 3.1
Demand curve of an individual house
such as batteries, could improve generation effi ciency, but would have to be quite large, and
therefore expensive, in relation to the average demand. If each household in the UK met its
own maximum demand of say 5 kW, 100 GW of plant would be needed for this sector
alone.
3.2.2 Aggregation
The smoothing benefi t arising from aggregation is of vital importance to electricity utilities.
The more uncorrelated the demand among consumers, the more effective the overall smooth-
ing. For a large power system this statistical effect is dramatic and is illustrated by the char-
acteristic demand profi le shown in Figure 3.2. This shows a typical demand curve over a day
for the whole of England and Wales and should be contrasted with Figure 3.1. Not only is
the peak to mean ratio considerably reduced but this curve is noticeably much smoother than
that of the individual house. As a consequence it is much easier to predict, and the generation
required to supply this aggregate load can be scheduled and controlled very effi ciently, as
will be discussed later.
The value of interconnection to form large power systems should now be clear: it allows
demand aggregation and the benefi ts that stem from this, primarily through the easier match-
ing of supply and demand. Some proponents of renewable energy suggest that national grids
will become redundant once generators are located near to consumers, but this is a miscon-
ception unless an unprecedented breakthrough in energy storage technology is achieved.
Indeed, given the intrinsic variability of many dispersed renewable energy sources, intercon-
nection may well prove to be even more valuable in the future.