Environmental Engineering Reference
In-Depth Information
35
62
69
76
38
150
55
42
92
65
31
43
82
34
29
42
31
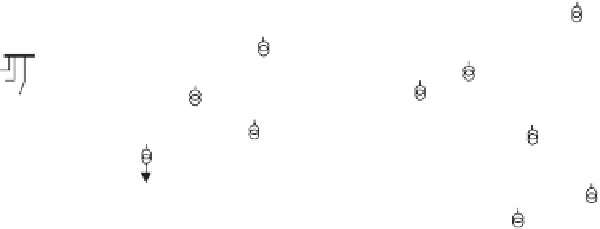
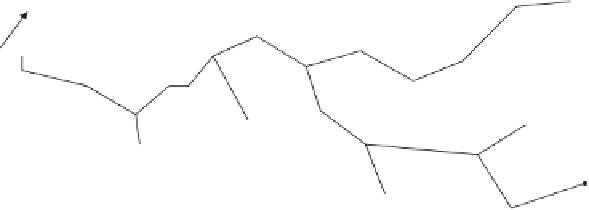
Figure 6.4
Example fault levels (in MVA) throughout a typical rural 11 kV feeder
Table 6.4
Node data (input to load fl ow)
Node number
P
(kW)
Q
(kVAR)
1
2
3
− 238
− 71
4
− 159
− 48
5
6
− 340
− 102
7
− 178
− 53
8
9
10
500
− 250
1 1
− 458
− 137
1 2
− 221
− 66
1 3
1 4
− 97
− 29
1 5
− 386
− 116
1 6
− 161
− 48
1 7
−
64
−
19
a rated output this provides an injection of 500 kW and the absorption of 250 kVAR at node
10. In order to determine the voltage profi le of the network under these conditions there is a
need to assess whether this proposal is feasible. To proceed with the load fl ow analysis it is
required that two variables are defi ned at each node. This distribution network consists solely
of consumer
PQ
nodes and one embedded generator that can also be treated as a
PQ
node.
The input data to the load fl ow are shown in Table 6.4.
The results of the load fl ow analysis are shown in Figure 6.5. The voltage profi le at con-
sumer nodes is easily within the acceptable limits of
1%. At the PCC the rise of voltage
due to the active power injection is in this case moderated by the extraction of reactive power
from the renewable energy source. Of course, if capacitors are installed at the wind turbine
±