Geoscience Reference
In-Depth Information
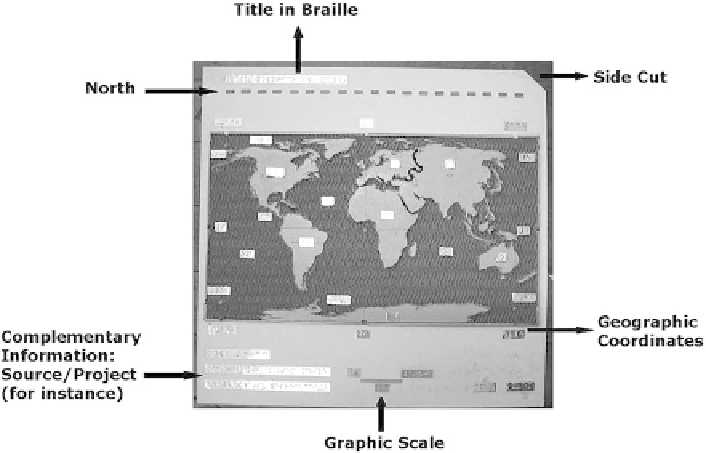
Fig. 24.4 Tactile map with the proposed standardization
Besides, it was defined that all written information needed for reading the map
would be made in Braille—title, scale values and the legend.
After the definition of the final originals for each participating country, data were
collected on their population and climate for the compilation of graphics that
complement the maps already produced in order to help the teaching of these
subjects (Figs.
24.5
,
24.6
).
The last stage focused on the search of cartographic bases for producing at least
one urban (downtown) map or a map of the most relevant area of the cities from 18
Latin American countries. These maps were made for orientation and moving in the
city. This is why the maps were produced at large scale, which helped identifying
the important buildings. Every country chose a central area of the capital, except for
Brazil, which represented a part of S˜o Paulo downtown.
The maps were made in collage and copied on transparent plastic in order to add
the printed information to the whole. Beyond the urban maps, models of classrooms
were made by the schools that collaborated to the evaluations of the first stage. The
result was 18 urban maps, 4 enlargements of these maps (La Paz, S˜o Paulo, Quito
and Lima) and 16 maps from schools that participated in the classroom project.
For constructing the tactile graphic representations, tests on the durability and
heat resistance of the materials were made. The thermophorm machine, which
reproduces the maps, works with a vacuum and heat system, therefore, the originals
must be resistant. Thus, a large number of copies can be made from the originals.
After the tests, several types of card paper, metals, wood sticks, sandpaper and
several threads were selected for representing information in a tactile shape. Braille
Search WWH ::

Custom Search