Geoscience Reference
In-Depth Information
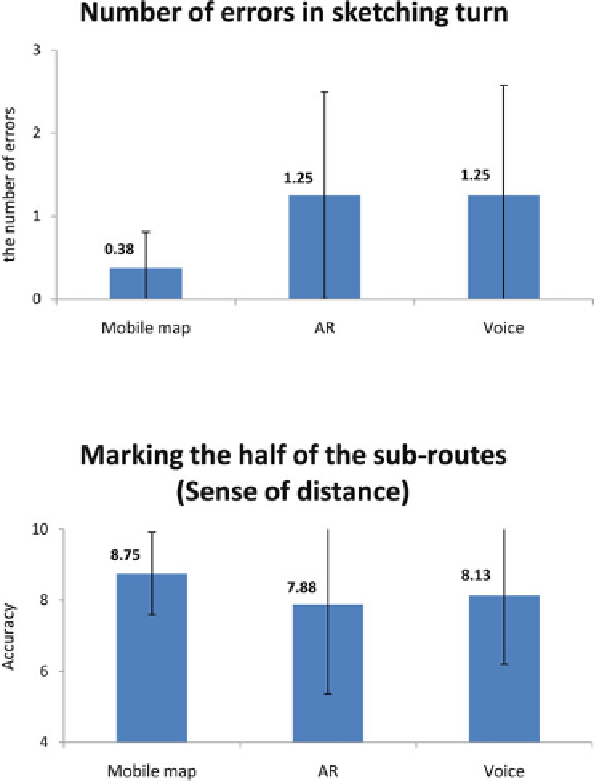
Fig. 11.5 How the number of errors in sketching turns differs among different navigation
conditions.
Vertical bars
denote 95% confidence intervals
Fig. 11.6 How the sense of distance differs among different navigation conditions.
Vertical bars
denote 95% confidence intervals
The results in Fig.
11.6
show that map users performed better in marking the half
of the sub-route compared to AR users and voice users. However, the differences
among them were not significant as we expected. An explanation may be that map
users did not make full use of the map-based prototype. As a result, for all three
navigation conditions, the knowledge about sense of distance was mainly gained
from sensual perception of the real world , but not from the navigation prototypes.
The comparable results of three navigation conditions might be also due to the poor
differentiation of the grading system.
According to the ANOVA test, the difference among these three navigation
conditions was not significant (F(2,21)
0.30, p
0.74).
¼
¼
Search WWH ::

Custom Search