Agriculture Reference
In-Depth Information
Irrigation, mm
50
250
450
650
850
1050
1250
28
(P
m
, ET
m
)
(P
m
, Q
m
)
24
1
20
S
p
16
(Y
m
, ET
m
)
(Y
m
, Q
m
)
12
1
8
S
y
(P, Q
o
)
4
(Y, Q
o
)
0
0
300
600
900
1200
1500
Field Water Supply, mm
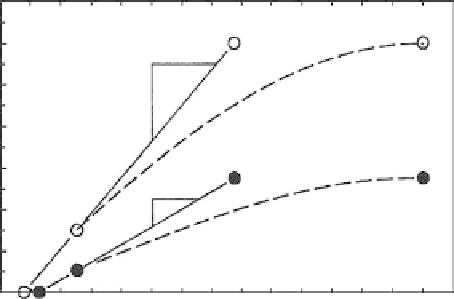
fIguRe 19.6
Hypothetical example illustrating a relationship between dry matter and grain
production and field waters. (From T.A. Howell, 1990, in: B.A. Stewart and D.R. Nielsen,
Eds.,
Irrigation of Agricultural Crops.
Agronomy 30. Madison, WI: American Society of
Agronomy, Crop Science Society of America, and Soil Science Society of America, pp.
391
-
434.)
was 0.33. The maximum P
m
and Y
m
values are 24 Mg
−1
and 10 Mg
−1
, respectively,
and represent the yields obtained when water was not limiting. The WUE
net
(yield
of grain in kilograms)/(ET in cubic meters) for the dryland crop would be 2000
kg/2500 cubic meters or 1 kg m
−3
. For the highest yield P
m
, the WUE
net
would be
approximately 10,000 kg/7500 cubic meters or 1.33 kg m
−3
. Theoretically, there is
a straight-line relationship between water use and yield of either grain or above-
ground biomass after the threshold amount has been supplied. Using the grain yield
of this example, there was no grain produced until approximately 100 mm of water
was utilized, but once the threshold value was reached, additional water utilized as
ET water increased the yield about 1.5 kg m
−3
. Therefore, the WUE
net
is always the
highest at the highest yield because the threshold portion of the water used becomes
a smaller portion of the total water used for ET. The WUE
irrigation
may decrease with
increasing yields. In the example, 1150 mm of irrigation water was required to pro-
duce the maximum grain yield of about 10 Mg ha
−1
, but the addition of only 450
mm would have produced about 9 Mg ha
−1
. Therefore, the WUE
irrigation
would be
much lower for the maximum grain yield. The deviation of the dashed curves from
the lines represents the combined effects of the irrigation hydrology (runoff, deep
percolation, soil water recharge, spray evaporation, drift, etc.) with the effects of the
irrigation water salinity, irrigation application uniformity, and the spatial variability
of the soil physical parameters. In theory, with high-quality water and an efficient
irrigation system, the deviation between the ET line and the dashed line representing
field water supply can be close to each other. Howell (1990) stated, for the example
depicted in Figure 19.6, that (1) the maximum water use efficiency (Y/ET) occurs at
the point (Y
m
, ET
m
); (2) maximum irrigation use efficiency (Y/Q) occurs at a value of