Information Technology Reference
In-Depth Information
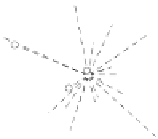
(a)
(b)
Fig. 1.1.
Two different interpretations for clustering a set of data points into two distinct
clusters. The circles and squares are data points that are assigned to different clusters.
The dashed circle and square represent the centres of the identified clusters. (a) Iden-
tifying clusters by minimising the distance between the data points within a cluster, and
reassigning data points to the cluster to whose centre they are closest to. The dashed lines
indicate the assignment of data points to cluster centres, given by the mean of all data
points within the cluster. (b) Interpreting the data points as being generated by Gaus-
sians that are centred on the cluster centres. The two dashed circles around the centres
represent the first and the second standard deviation of the generating Gaussian.
standard instance. In other words, assume the attribute values of each instance
of a particular class to be
generated
by sampling from a Gaussian that is centred
on the attribute values of the standard instance of this class, where this Gaus-
sian models the noisy instantiation process (for an illustration see Figure 1.1(b)).
Furthermore, let us assume that each class has generated
all
instances with a
certain probability.
This model is completely specified by it
parameters
, which are the centres of
the Gaussians and their covariance matrices, and the probability that is assigned
to each class. It can be trained by the principle of maximum likelihood by ad-
justing its parameters such that the probability of having generated all observed
instances is maximised; that is, we want to find the model parameters that best
explain the data. This can be achieved by using a standard machine learning
algorithm known as the
expectation-maximisation (EM)
algorithm [71]. In fact,
assuming that each dimension of each Gaussians is independent and has equal
variance in each of the dimensions, the resulting algorithm provides the same
results as the K-means algorithm [19]; so why take effort of specifying a model
rather than using K-means directly?
Reconsidering the questions that were posed in the previous section makes
the benefit of having a model clear: it makes explicit the assumptions that are
made about the data. This also allows us to specify when the method is likely to
fail, which is when we apply it to data that does not conform to the assumptions
that the model makes. Furthermore, in this particular example, instances are not
assigned to single clusters, but their probability of belonging to either cluster is
given. Also, the best number of clusters can be found by facilitating techniques
from the field of
model selection
that select the number of clusters that are most
suitable to explain the data. Additional advantages are that if Gaussians do not
describe the data well, they can be easily replaced by other distributions, while


Search WWH ::

Custom Search