Environmental Engineering Reference
In-Depth Information
Stream 2
Stream 11
Stream 9
Stream 12
Stream 5
Stream 7
time h
time h
Figure 2.19
Comparison of estimated (dotted line) and simulated (continuous line) ore flowrates
in six different streams
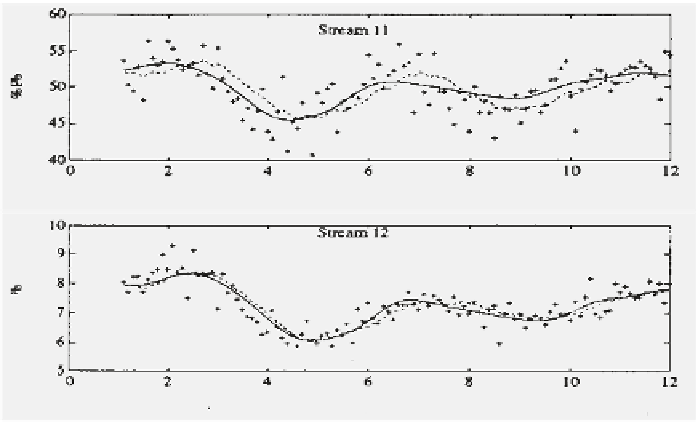
Stream 11
time h
Stream 12
time h
Figure 2.20
Comparison of measured (crosses), estimated (dotted line) and simulated (continuous
line) lead grades in two selected streams


Search WWH ::

Custom Search