Environmental Engineering Reference
In-Depth Information
the controller decreases the ore feedrate in order to compensate for this disturbance.
This keeps mill operation at optimal conditions, as seen in Figure 5.21. Figure 5.22
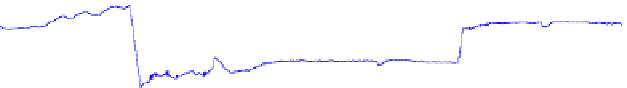
shows that pebble flowrate and sump level stay within the pre-defined limits. The
percentage-of-solids control loop is able to cope with interactions and changes to
set-point, as seen in Figure 5.23.
400
300
200
150
200
250
300
350
400
450
500
80
60
40
20
150
200
250
300
350
400
450
500
800
700
600
500
150
200
250
300
350
400
450
500
Samples (k)
Figure 5.22
Optimizing controller: pebbles flowrate, sump level, pulp flowrate
70
65
60
55
50
150
200
250
300
350
400
450
500
100
80
60
40
150
200
250
300
350
400
450
500
Samples (k)
Figure 5.23
Optimizing controller: percentage of solids and water flowrate


Search WWH ::

Custom Search