Environmental Engineering Reference
In-Depth Information
70
65
60
55
50
150
200
250
300
350
400
450
500
100
80
60
40
150
200
250
300
350
400
450
500
Samples (k)
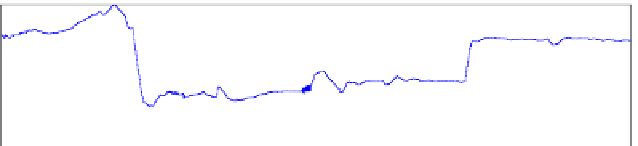
Figure 5.20
Stabilizing controller: percentage of solids and water flow rate
The supervisory level (second level) calculates a set-point for filling level so that
the SAG mill always operates at a point near its maximum possible power draw.
Power draw level is modeled as a quadratic function of mill filling level [37]. The
strategy tries to maximize power draw while keeping all variables within defined
constraints. If no constraint is active, then optimal operation will be obtained when
the gradient of this quadratic function is zero.
40
30
20
150
200
250
300
350
400
450
500
1400
1200
1000
150
200
250
300
350
400
450
500
10
9
150
200
250
300
350
400
450
500
0.2
0
−0.2
150
200
250
300
350
400
450
500
Samples (k)
Figure 5.21
Optimizing controller: filling level, fresh flowrate, mill speed, gradient
Figure 5.21 shows how the supervisory level changes the set-point every 50 min-
utes so that ore feedrate is maximized. Gradient values near zero provide an indica-
tion of being at an optimal value. At time 250 minutes, ore hardness increases and


Search WWH ::

Custom Search