Environmental Engineering Reference
In-Depth Information
32
30
28
26
1000
1500
2000
2500
3000
3500
4000
1.074
x 10
4
1.072
1.07
1.068
1.066
1.064
1000
1500
2000
2500
3000
3500
4000
Samples (k)
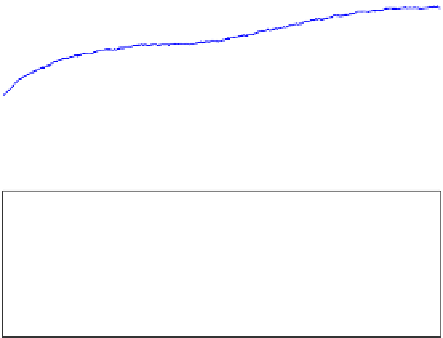
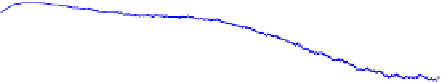
Figure 5.17
Level and power draw for a change in the ore hardness with a 1200 ton/h ore feedrate
Outputs are:
1. power draw (
y
1
);
2. pebbles flowrate (
y
2
);
3. sump level (
y
3
);
4. pulp density of sump output flowrate (
y
4
);
5. level filling (
y
5
);
and disturbances:
1. hardness (
d
1
);
2. feed particle size distribution (
d
2
).
In this application, all output variables are not required to reach a set-point. Some
of them, for example the flow rate of pebbles, are only required to stay within a
certain range.
In the first level, four control loops are implemented: inlet pressure in the hy-
drocyclones is controlled by the number of hydrocyclones in operation. (Therefore,
this variable is considered as constant in this simulation.) Sump level is controlled
by pump speed, considering a model in terms of pump speed, water flowrate and
fresh ore feedrate. Density is controlled by the water feedrate and also considers ore
feed rate as a measurable disturbance. Filling level is controlled by the ore feedrate
and mill speed is subject to constraints in the pebble flowrate. The controller consid-
ers a model including mill speed, fresh ore feedrate and the pebble flowrate, which
is modeled in terms of mill speed and fresh ore feedrate.
The stabilizing strategy was simulated by considering a constant particle size
distribution and a ratio between water flowrate and ore feedrate of 76% as well as a
change of 30% in ore hardness at time 250 minutes. Figure 5.18 shows the response


Search WWH ::

Custom Search