Environmental Engineering Reference
In-Depth Information
3
DT
+65#
AIC
4
C
P
*
DT
DIC
G
s
2
LT
LIC
hp*
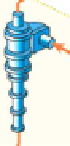
Figure 4.17
Grinding circuit for which the particle size soft sensors are designed. Fresh feed ore
flow
G
s
is conveyed to the sump where it joins the sump water flow
Q
1
w
and the hydrocyclones
underflow [5]. The sump discharge flow [2] is pumped to the hydrocyclones feed. At the hydrocy-
clones overflow [3] a particle size sensor (AT) measures the proportion of particles retained by 65
mesh. Hydrocylones feed density is controlled to set-point
Cp
∗
by a PID controller manipulating
the sump water feed through a local flow control. The sump level is similarly controlled using the
pump speed as manipulated variable
S
−
3
S
p
S
p
(
t
−
2
),
(
t
−
1
),
J
BM
(
t
−
1
)
(
t
),
p
(4.136)
G
s
(
t
−
1
)
J
BM
(
t
−
3
)
S
p
(
t
−
3
),
)
,
G
s
(
t
−
1
)+
Q
1
w
(
t
(see Table 4.7).
Soft sensor set.
The best determined models are listed below. Table 4.8 shows the measurements
used and omitted in the design of each soft sensor model. It can be seen that the
solids proportion
S
p
is included in four out of the five models. Therefore the hydro-
cyclone feed density measurement is very important, since it determines
S
p
.
Model 1
S
p
f
65
(
t
)=
θ
10
f
65
(
t
−
1
)+
θ
11
J
BM
(
t
−
1
)
(
t
)
+
θ
12
J
BM
(
t
−
3
)
S
p
(
t
−
3
)+
θ
13
.
(4.137)
Model 2
f
65
(
t
)=
θ
20
f
65
(
t
−
1
)+
θ
21
S
p
(
t
−
2
)+
θ
22
.
(4.138)


Search WWH ::

Custom Search