Environmental Engineering Reference
In-Depth Information
A
B
(a) (b)
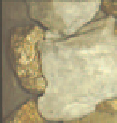
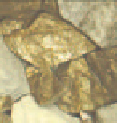
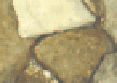
Figure 3.25
Typical rock mixture images. (a) Composite. (b) As would appear on a conveyor belt.
From Tessier
et al.
[26]
(a)
After applying the machine vision approach to the 10 validation composite im-
ages, the results presented in Table 3.3 were obtained: this shows a comparison
between true and estimated surface composition. The latter is defined as the per-
centage of the field of view of the image occupied by each of the three rock classes.
As expected, the results are more accurate for dry rocks than for wet rocks. Even if
the PLS-DA model partially removed systematic variations associated with surface
moisture, wet rock images have much less contrast. Furthermore, most classification
errors come from the overlap of the medium hardness/grade rock class with the other
two. On average, the classification model provides satisfactory results as shown at
the bottom of Table 3.3 (see mean as well as correlation between true and estimated
compositions). Results are very good for dry rocks but classification performance
degrades for wet rocks.
3.5.3.5 Mineral Type Recognition on a Conveyor Belt
A simulated conveyor belt application was performed on more realistic rock mixture
images (Figure 3.25(b)) to complete the proof of concept of the proposed machine
vision approach. To maximize the coverage of rock mixtures, the ternary mixture
design shown in Figure 3.26 was used. A total of 17 mixtures of the three rock
types were selected. Among this number, 13 involve the three rock classes, and
five others consist of each of the individual rock species. These mixtures are shown
schematically in Figure 3.26 (a) whereas the corresponding proportions are provided
in the table, Figure 3.26 (b). Note that the proportions used in this design are weight
percentages.
Once the amounts (
i.e.
, weights) of each rock type required by any given exper-
iment were gathered, the loads were manually mixed and spread on the conveyor
belt. Each load covered from 8 to 15 feet of conveyor length. As the belt moved
forward, several images of the rock mixtures were captured. The number of images
collected for each mixture is also given in Figure 3.26(b). Here again, after captur-
ing a dry rock mixture image, and before moving the belt, the rocks were watered
and a wet image was collected. Correspondence between dry and wet rock images


Search WWH ::

Custom Search