Environmental Engineering Reference
In-Depth Information
A
(a)
MIA
Score density histogram
B
(b)
t
2
C
(c)
t
1
Masking/overlay
Figure 3.18
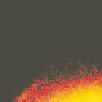
Computing the amounts of BH and CL using a composite image of a zinc froth. (a)
Composite image of a lean (left) and heavily load froth (right). (b) 2-D score density histogram
obtained for MIA applied to the composite image. (c) Extraction of BH and CL features using the
score histogram (white mask). Adapted from Liu
et al.
[37]
neath the mask are mapped into the original composite image. This technique allows
one to compute the total number of black pixels within a given froth image.
Since both CL and BH features appear black in froth images, it would be im-
possible to discriminate these features without additional, contextual information.
These two features appear in very different froth conditions, the former when the
froth is lean (
i.e.
, large bubbles) and the latter when the froth is overloaded (
i.e.
,
small bubbles). Therefore, a two-class Fisher linear discriminant classifier [77] was
trained on the froth wavelet size signatures discussed previously in order to assign
the black pixels (
i.e.
, those falling under the white mask) to either CL or BH.
3.5.2.3 Froth Health Monitoring
The objective of froth health monitoring is to provide early detection of changes
in the ore feed that would require the operators to adjust reagent dosage in order
to maintain desired metallurgical performance (
i.e.
, grade and recovery). Observing
such changes in ore feed would necessitate collecting images over long periods of
time. Thus, it was decided to mimic inappropriate dosage of an ore feed by making
designed changes on some of the reagents while the ore feed was relatively constant


Search WWH ::

Custom Search