Environmental Engineering Reference
In-Depth Information
The last row in Table 3.1 provides an estimate of standard prediction error for
each element, obtained using the Jackknife resampling approach [66-68]. Basically,
when performing leave-one-out cross validation, 50 PLS sub-models are fitted to
subsets of
X
F
and
Y
. If predictions obtained using each sub-model are stored, then
one can use these 50 prediction vectors to estimate the model uncertainties (
i.e.
,
SE
Jackkni f e
). Measurement uncertainties (including sampling, handling, and analyti-
cal errors) were, unfortunately, not evaluated in this study.
Air
Activator
C
ollect
o
r
60
55
50
45
4
2
0
10
8
6
600
400
200
1
0.5
0
0
200
400
600
800
1000
1200
1400
1600
1800
2000
Observation number
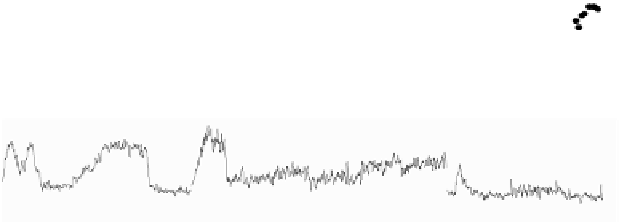
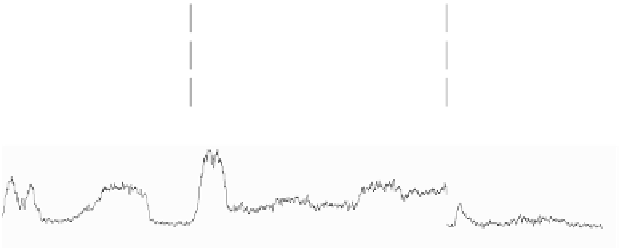
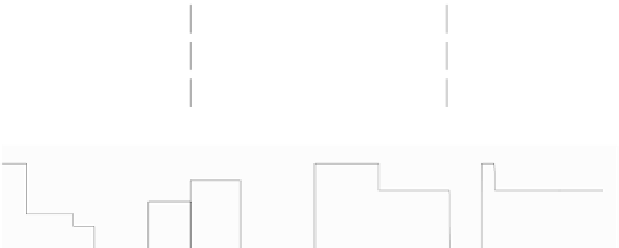
Figure 3.15
Concentrate grade prediction results obtained for the tests on collector, air, and activa-
tor flow rates at Agnico-Eagle/Laronde's zinc circuit. PLS model predictions (-), grade assays (
).
Error bars correspond to the model one standard prediction error estimate (
SE
Jackkni f e
). Adapted
from Duchesne
et al.
[35]
•
Time series of model predictions compared with laboratory grade assays are
shown in Figure 3.15. The results for the three tests (collector, air, activator) are


Search WWH ::

Custom Search