Environmental Engineering Reference
In-Depth Information
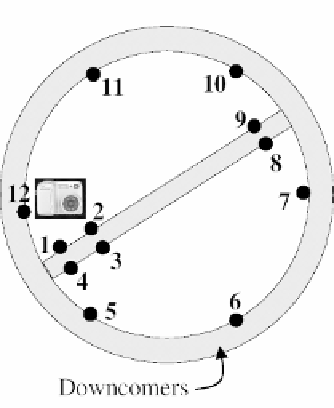
Figure 3.14
Froth sampling strategy used for the contact cell at Laronde's plant
describing the model predictive ability are summarized in Table 3.1. The model
explained 67% of the variations in
Y
using 44% of the information in
X
F
(see cu-
mulative
R
Y
and
R
X
). About 80% of the variations in lead and silver contents are
explained by the color features of the froth (see
R
Y
values). Cross-validation results
(
Q
Y
) are also very similar. Sphalerite content (Zn) had a lower explained variance,
however, model predictions follow the trends quite well, as is shown in Figure 3.15.
Pyrite was the most difficult to predict using froth color. This reminds us of the
basis and limitations of the approach: a mineral cannot be detected by imaging if
changes in its concentration do not introduce a distinguishable color change on the
froth surface. One cannot expect that such a simple low cost solution will replace
more expensive X-ray (
i.e.
, OSA) or laboratory analyses. However, prediction re-
sults obtained for some elements are acceptable for detecting disturbances occurring
between OSA measurements.
Tabl e 3. 1
Statistics describing the predictive ability of the PLS model with four latent variables
Statistics
Zn (%)
Pb (%)
Fe (%)
Ag (g/t)
Cumulative
R
Y
(%)
0.61
0.87
0.41
0.81
0.67
Q
Y
(%)
0.51
0.84
0.27
0.79
0.60
R
X
(%)
-
-
-
-
0.44
SE
Jackkni f e
1.63
0.34
0.79
30.90
-


Search WWH ::

Custom Search