Environmental Engineering Reference
In-Depth Information
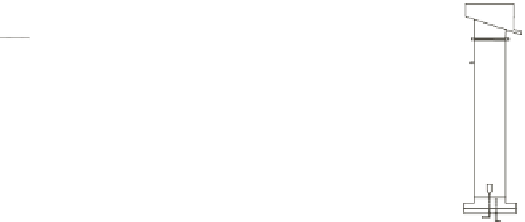
Camera
CuSO
4
solution
(activation of zinc
surface)
Froth
Lime (pH control)
Feed
Collector
Zinc concentrate
(to other rougher
cells)
Air
Tailings (to scavenger)
Figure 3.13
A schematic diagram of Agnico-Eagle/Laronde's zinc circuit and image acquisition
system. From Liu
et al.
[37]
sample and the froth images, which would have been much larger if the concen-
trate samples had been collected after several meters of piping. The disadvantage
of this sampling approach, however, is that the calibration model establishes a re-
lationship between a local image of froth and an average grade measurement. If
grade distribution on the froth surface is not homogeneous (as was later observed
by Bartolacci
et al.
[36]), a lack-of-fit should be expected from the model. Neverthe-
less, this approach was selected to verify the robustness of a model based on a local
froth image. In total, 50 composite samples were assayed for their content of zinc
(Zn-sphalerite), lead (Pb-galena), iron (Fe-mainly pyrite), and silver (Ag-several
minerals). Most of these samples were gathered during the collector and activator
testsasairflow rate was not expected to have a significant effect on grade.
The PLS calibration model uses the color features of the froth images (regressor
variables,
X
F
) corresponding to the 50 grade measurements (response variable,
Y
)
collected during the tests. Synchronization of the images and grade measurement
was performed before the analysis. The color features were extracted by applying
a2-D30
30 rectangular grid to the
t
1
-
t
2
score density histogram of each image
(see Figure 3.7), computed based on a global MIA model (
i.e.
, using the entire set
of froth images). The columns of the feature matrix
X
F
correspond to the number of
pixels falling in each bin of the grid (
i.e.
, particular combination of
t
1
-
t
2
values), and
hence, to a particular color. The 2-D score histograms of all images are congruent
since they were obtained based on a common set of MIA loading weights and a
common scaling range for score values. This means that variations in the number
of pixels falling within a given bin across a set of images reflect a variation in the
amount of the corresponding color within those images. The resulting matrices had
the following dimensions:
X
F
(50
×
1).
A four latent variable PLS model was built on the
X
F
-
Y
dataset. Leave-one-
out cross-validation was used to select the number of components. The statistics
×
(30
×
30)),
Y
(50
×


Search WWH ::

Custom Search