Environmental Engineering Reference
In-Depth Information
G
d
D(s)
P(s)
G
FF
Y(s)
Y
sp
(s)
+
+
+
+
G
c
G
p
+
+
-
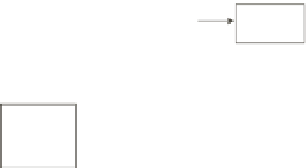
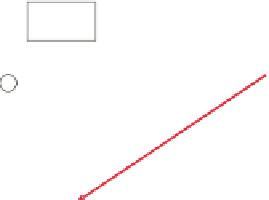
Figure 3.1
Standard feedback/feedforward control loop with controlled and disturbance variables
measured using machine vision
particular, these methods have been used for analyzing spectral data for ore charac-
terization and sorting [5] and for monitoring of crushing and grinding mills [6, 7],
for post-analysis and monitoring of grinding mills and flotation plants [8-11], and
for soft-sensor development [12]. In these applications the relevant process states
could be extracted from the large data sets obtained from standard process sensors
(
e.g.
, flow, pressure, pH, power draw,
etc.
) and/or from analytical instruments (
e.g.
,
vibrations, assays, size distributions,
etc.
). However, in some situations, and partic-
ularly in mineral processing where the materials are solids or slurries, the desired
process information cannot be easily obtained from standard instrumentation but
can be
visually
interpreted and evaluated using machine vision techniques.
For example, consider Figure 3.1 showing a standard feedback/feedforward con-
trol loop. Variables
Y
,
Y
sp
,
D
and
P
correspond to the controlled variable, its set-
point, a measured, and an unmeasured disturbance, respectively. The
G
sarethe
appropriate transfer functions. Tracking changes in the composition of run-of-mine
ore (
i.e.
, disturbance
D
), monitoring variations in the quality or “health” of a froth
flotation process, or in the amount of heat transferred to solids by combustion in
a rotary kiln (both
Y
s) are examples of difficult to measure variables using con-
ventional instrumentation that can be visually appraised by experienced operators
and engineers. Once automated using machine vision techniques, the information
extracted from these images can be used in process control loops. Indeed, a very
common example in mineral processing is on-line particle size analysis using com-


Search WWH ::

Custom Search