Information Technology Reference
In-Depth Information
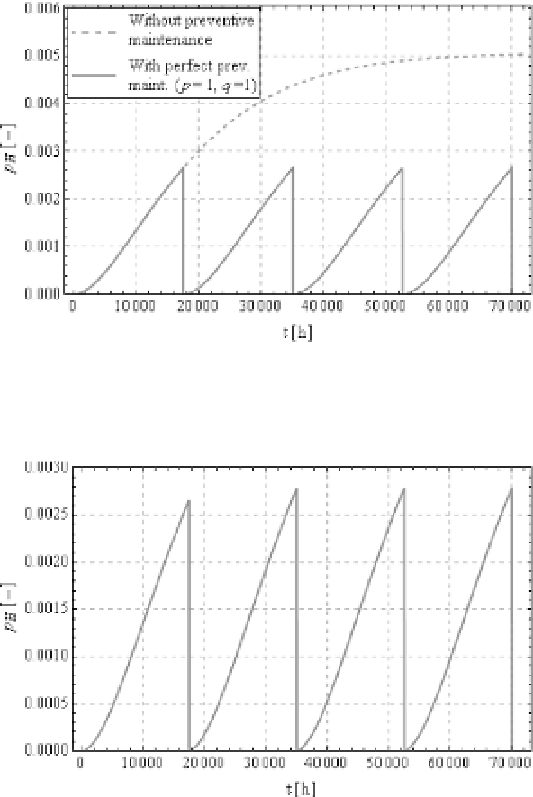
Fig. 5. Probability of the hazardous state for the 2-out-of-2 system with
λ
=5
·
10
−
5
h
−
1
,
c
=0
,
99
,
δ
=1
h
−
1
Fig. 6. Probability of the hazardous state for the 2-out-of-2 system with
λ
=5
·
10
−
5
h
−
1
,
c
=0
,
99
,
δ
=1
h
−
1
,
p
=0
,
9
and
q
=1
of the not preventively maintained system to
the system which is preventively maintained every other year and whose ideal
preventive maintenance is capable of detecting all failures that can occur in
the system. Plot in the Fig. 5 shows that in the case of perfect preventive
maintenance the maximum value of the
p
H
(
Fig. 5 compares the
p
H
(
t
)
during system lifespan depends
only on the duration between preventive maintenances and does not depend
on the total up time of the system.
In contrast to Fig. 5 the plot in the Fig. 6 shows that maximum value
of
p
H
(
t
)
of the system with imperfect preventive maintenance increases with
every consecutive phase of operation. Since the system is down during pre-
ventive maintenance, therefore it can be assumed that
p
H
(
t
)
is independent of
the duration of the preventive maintenance, even though it cannot be directly
inferred from the Fig. 5.
t
)