Information Technology Reference
In-Depth Information
3
Modeling the Impact of Human Behavior on Safety
and Security of the Transportation Process
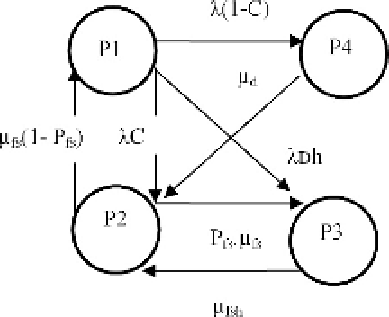
Vehicles movement is influenced by the vehicle's interaction with humans and
physical devices. The states of the transportation process can be described
through the Markov graph as follows:
- P1 - Human behavior and system operation are correct, no violation on
critical safety-system states
- P2 - System/human in fail-safe mode
- P3 - Human violation undetected
- P4 - Undetected device failure
-
λ
- Failure rate
-
μ
- Repair rate
- C - Coverage
- Pfs - Probability of unsafe human operation
-
λ
Dh - Unsafe human violation failure rate
The sequence of events describing the dynamic states of the system is
modeled through Markov graph given in Figure 4:
Fig. 4. Railway System Markov Model
The proposed model gives two dangerous system states - probability of
unsafe human behavior P3 and well-known probability of dangerous failures
of the railway system - P4. For the probability of unsafe human behavior
(P3) are considered not only the human errors during maintenance but also
intentional workforce, vandalism and unreasonable imprudent unsafe human
behavior during working conditions of the system. The probability of the
system being in a given state can be found by solving the homogeneous
differential equations (1) that describe the Markov process: