Database Reference
In-Depth Information
➤
Filter fields don't provide an easy way to tell what exactly is being filtered when you
select multiple items.
The left side of Figure 2-21 shows an example of this. The Region filter
has been limited to three regions: Midwest, North, and Northeast. However, the Region filter
shows (Multiple Items). By default, Filter fields show (Multiple Items) when you select more
than one item. The only way to tell what has been selected is to click the drop-down list. You
can imagine the confusion on a printed version of this report, where there is no way to click
to see which data items make up the numbers on the page.
When selecting multiple items in a slicer, you can easily see what's been chosen. On the right
side of Figure 2-21, you can see that the PivotTable is being filtered by the Midwest, North,
and Northeast regions — no more (Multiple Items).
Figure 2-21:
Filter fields show the words “(Multiple Items)” when multiple selections are made (left);
slicers do a better job at displaying multiple items (right).
Creating a standard slicer
To create a slicer, follow these steps:
1.
Place your cursor anywhere inside your PivotTable.
2.
On the Analyze tab, click the Insert Slicer button.
The Insert Slicers dialog box opens.
3.
Select the dimensions you want to filter.
4.
Click OK.
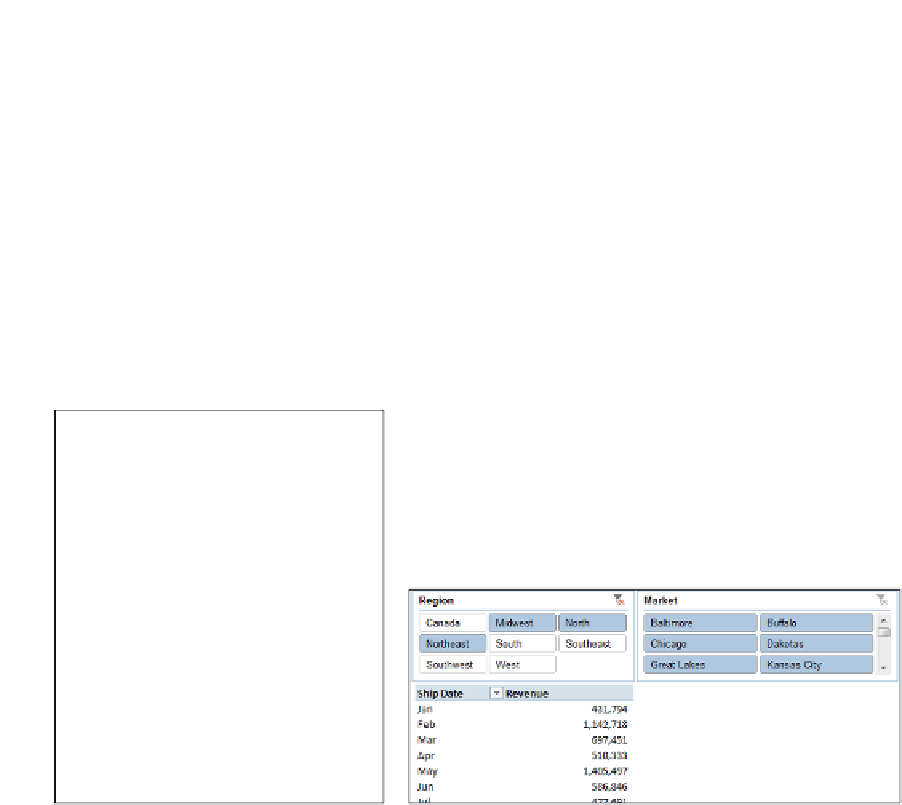
After the slicers are created, click the filter values to filter your PivotTable. As shown in Figure 2-22,
clicking Midwest in the Region slicer not only filters your PivotTable, but the Market slicer responds
by highlighting the markets that belong to the Midwest region.


Search WWH ::

Custom Search