Database Reference
In-Depth Information
PivotTables get their name from your ability to interactively drag and drop fields within the Pivot
Table to dynamically change (or pivot) the perspective, giving you an entirely new view using the
same source data. You can then display subtotals and interactively drill down to any level of detail
that you want. Note that the data itself doesn't change, and is not connected to the PivotTable. A
PivotTable is well suited to a dashboard because you can quickly update the view of your PivotTable
by changing the source data that it points to. This allows you to set up both your analysis and presen-
tation layers at one time. You can then press a button to update your presentation.
Anatomy of a PivotTable
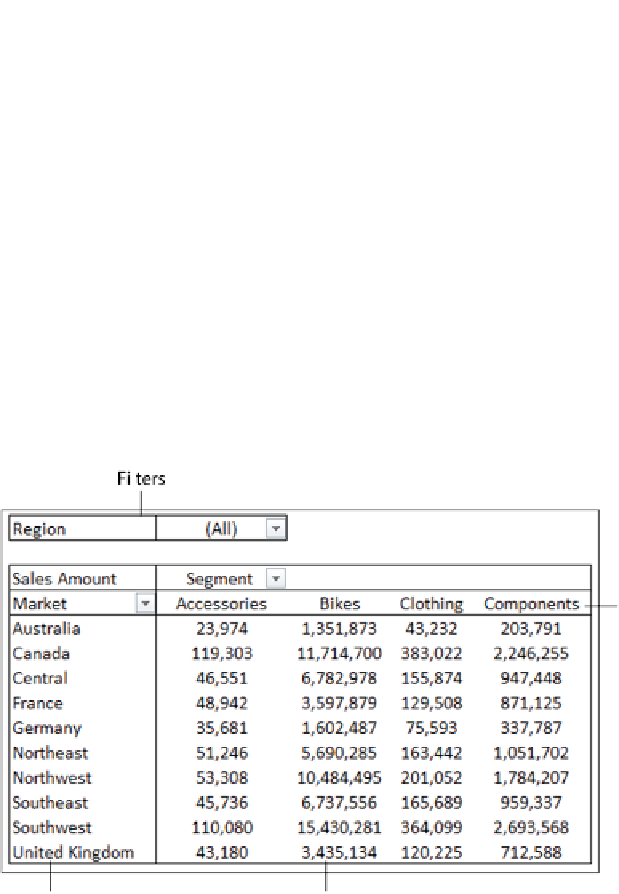
A PivotTable is comprised of four areas: Values, Rows, Columns, and Filters, as shown in Figure 2-1.
The data you place in these areas defines both the use and presentation of the data in your
PivotTable. In the following sections, we discuss the function of each area.
Figure 2-1:
The four areas of a PivotTable.
Values area
The Values area allows you to calculate and count the source data. It is the large rectangular area
below and to the right of the column and row headings. In this example, the Values area contains a
sum of the values in the Sales Amount field.
The data fields that you drag and drop here are typically those that you want to measure — fields,
such as the sum of revenue, a count of the units, or an average of the prices.
Rows area
Dragging a data field into the Rows area displays the unique values from that field down the rows of
the left side of the PivotTable. The Rows area typically has at least one field, although it's possible to
have no fields.


Search WWH ::

Custom Search