Database Reference
In-Depth Information
After the Detect Categories tool runs, you get a report that tells you how many categories were iden-
tified, gives each category a name (Category Name) and tells you how many rows/records are
included in each category (Row Count). The report also displays a Category Characteristics section
that contains the attribute details of each category.
In the result set shown in Figure 14-6, the Detect Categories tool found seven distinct categories.
Category 1 contains the most records. The primary attribute of Category 1 is the Income column. This
means that having an annual income of less than $39,050 was the most important driver for this par-
ticular category. If you were creating lead lists, Category 1 could be a list targeting low-income
customers.
Fill From Example
The Fill From Example tool automatically fills in missing data in a specified column for all rows in the
selected table, based on detected patterns in a set of samples you provide, and applies those to the
remaining missing values.
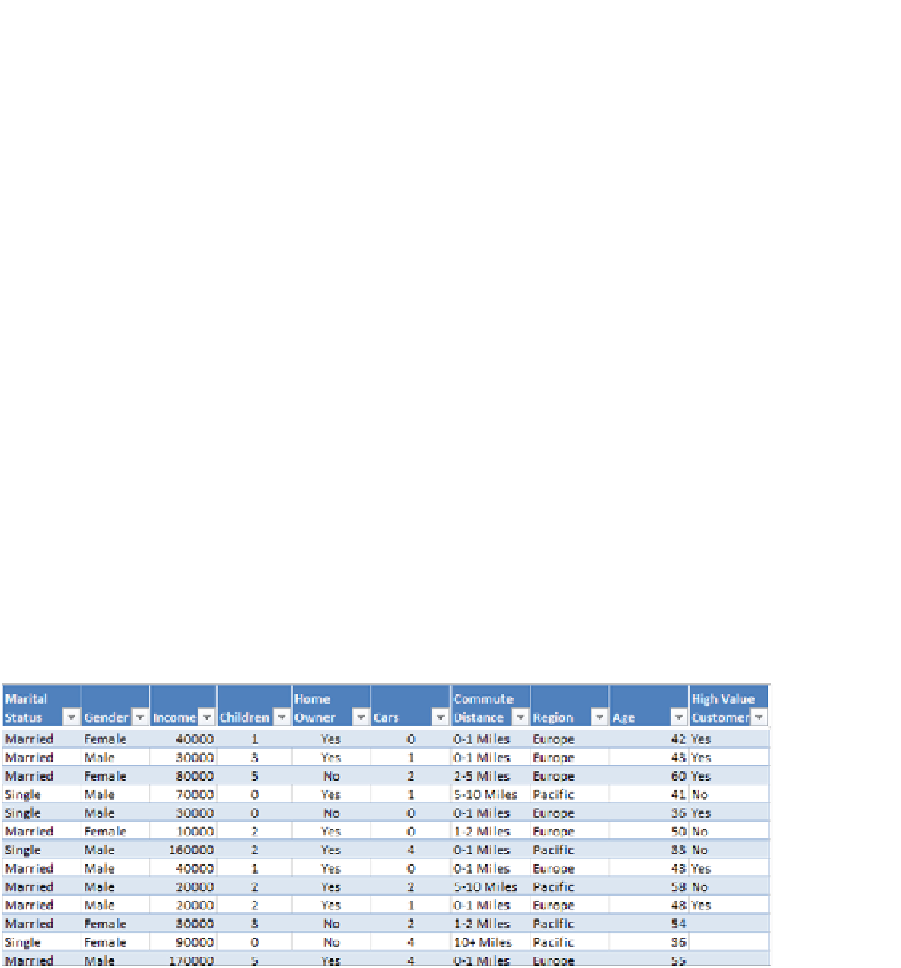
Figure 14-7 shows a table where the High Value Customer column is blank for most records. The first
ten rows of this column are filled with sample values. Based on the sample values, the Fill From
Example tool detects patterns that relate the other column values to the sample information we
added to the High Value Customer column, then extends those patterns to all the remaining rows.
Figure 14-7:
Start with a column (High Value Customer, in this case) that contains a handful of sample values.
Click the Fill From Example button on the Analyze tab. In the Fill From Example dialog box, select the
column you want to use as both sample input and interpolation for filling in values (in this example,
the High Value Customer column). Click the Run button and you get a report similar to the one
shown in Figure 14-8.


Search WWH ::

Custom Search