Database Reference
In-Depth Information
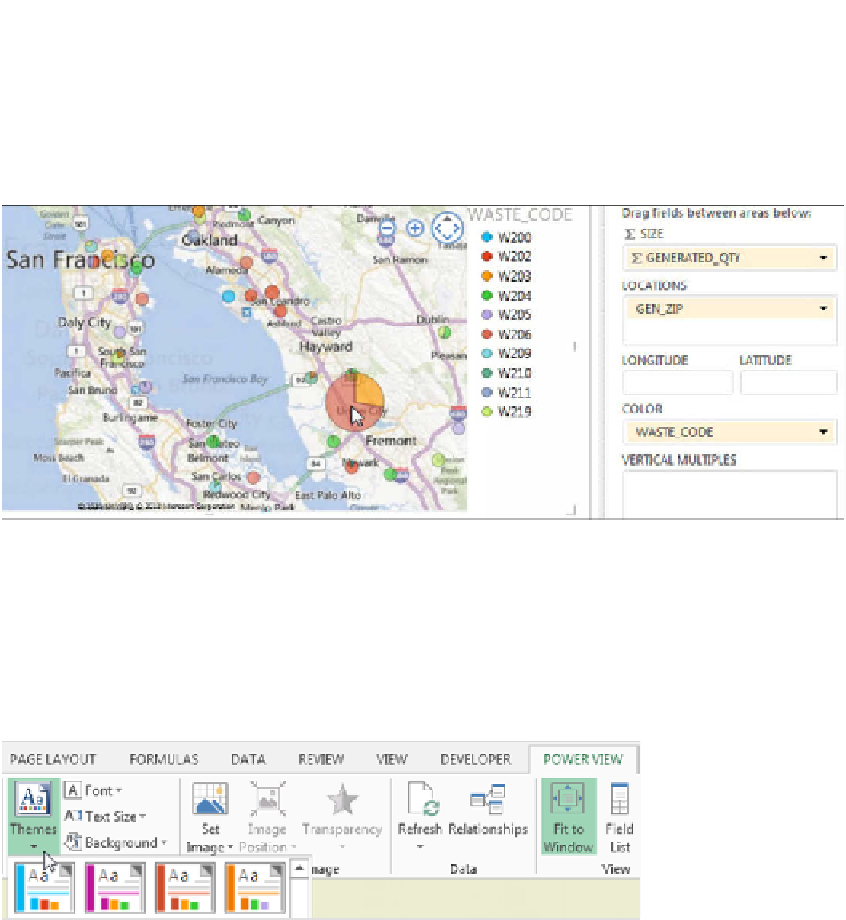
Add an extra layer of analysis.
Use the COLOR drop zone to add an extra layer of analysis to your
map. Figure 5-17 shows how adding the Waste_Code field to the COLOR drop zone differentiates
each plotted location based on waste code.
Figure 5-17:
Add data fields to the COLOR drop zone to add an extra layer of analysis to your map.
Changing the look of your Power View dashboard
You have limited control over how your Power View dashboard looks. From the Themes group on the
Power View tab (see Figure 5-18), you can set the overall font, text size, and background.
Figure 5-18:
Changing the theme of your Power View dashboard.


Search WWH ::

Custom Search