Information Technology Reference
In-Depth Information
4500
4450
4400
4350
4300
Winner DERand1DIter
F, Cr, CV
0.5, 0.1, 4249
4250
0
100
200
300
400
500
600
700
Fig. 7.42.
FSS tuning graphical display
60
Winner DERand1DIter
F, Cr, CV
0.5, 0.1, 4249
50
40
30
20
10
0
4250
4300
4350
4400
4450
4500
Cost Value
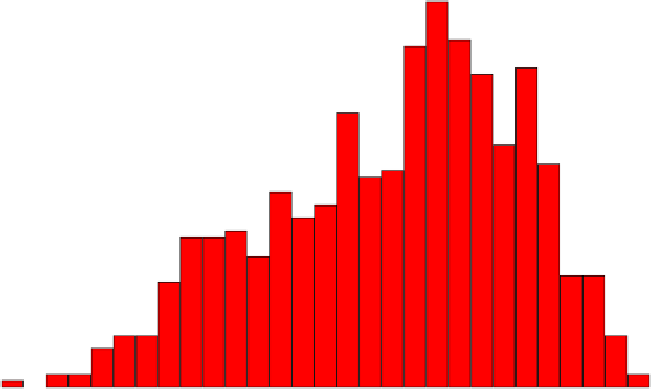
Fig. 7.43.
Frequency display for FSS tuning
The solution mesh for TSP is given in Fig 7.44.
The histogram display for all the values is given in Fig 7.45.
The optimal value obtained through this experimentation is given in Table 7.23.


Search WWH ::

Custom Search